How to quantify the unmeasurable
For rather obvious reasons mass eruption rate cannot be directly measured. (Neither exist flowmeters that would work under the "explosive" conditions at an eruption site -nor the volunteers willing to mount them!)
Therefore, more indirect methods have been developed to estimate at least some of the source conditions at the vent. Here is a just a few examples for such methods:
- high-speed particle velocimetry to quantify the exit velocity of the gas-particle mixture at the vent [1]
- recording and analyzing emitted infrasound waves [2,3]
- analyzing thermal infrared signatures [4,5]
- interpreting changes in the electrostatic field [6,7]
- video analysis of ash pulses [8]
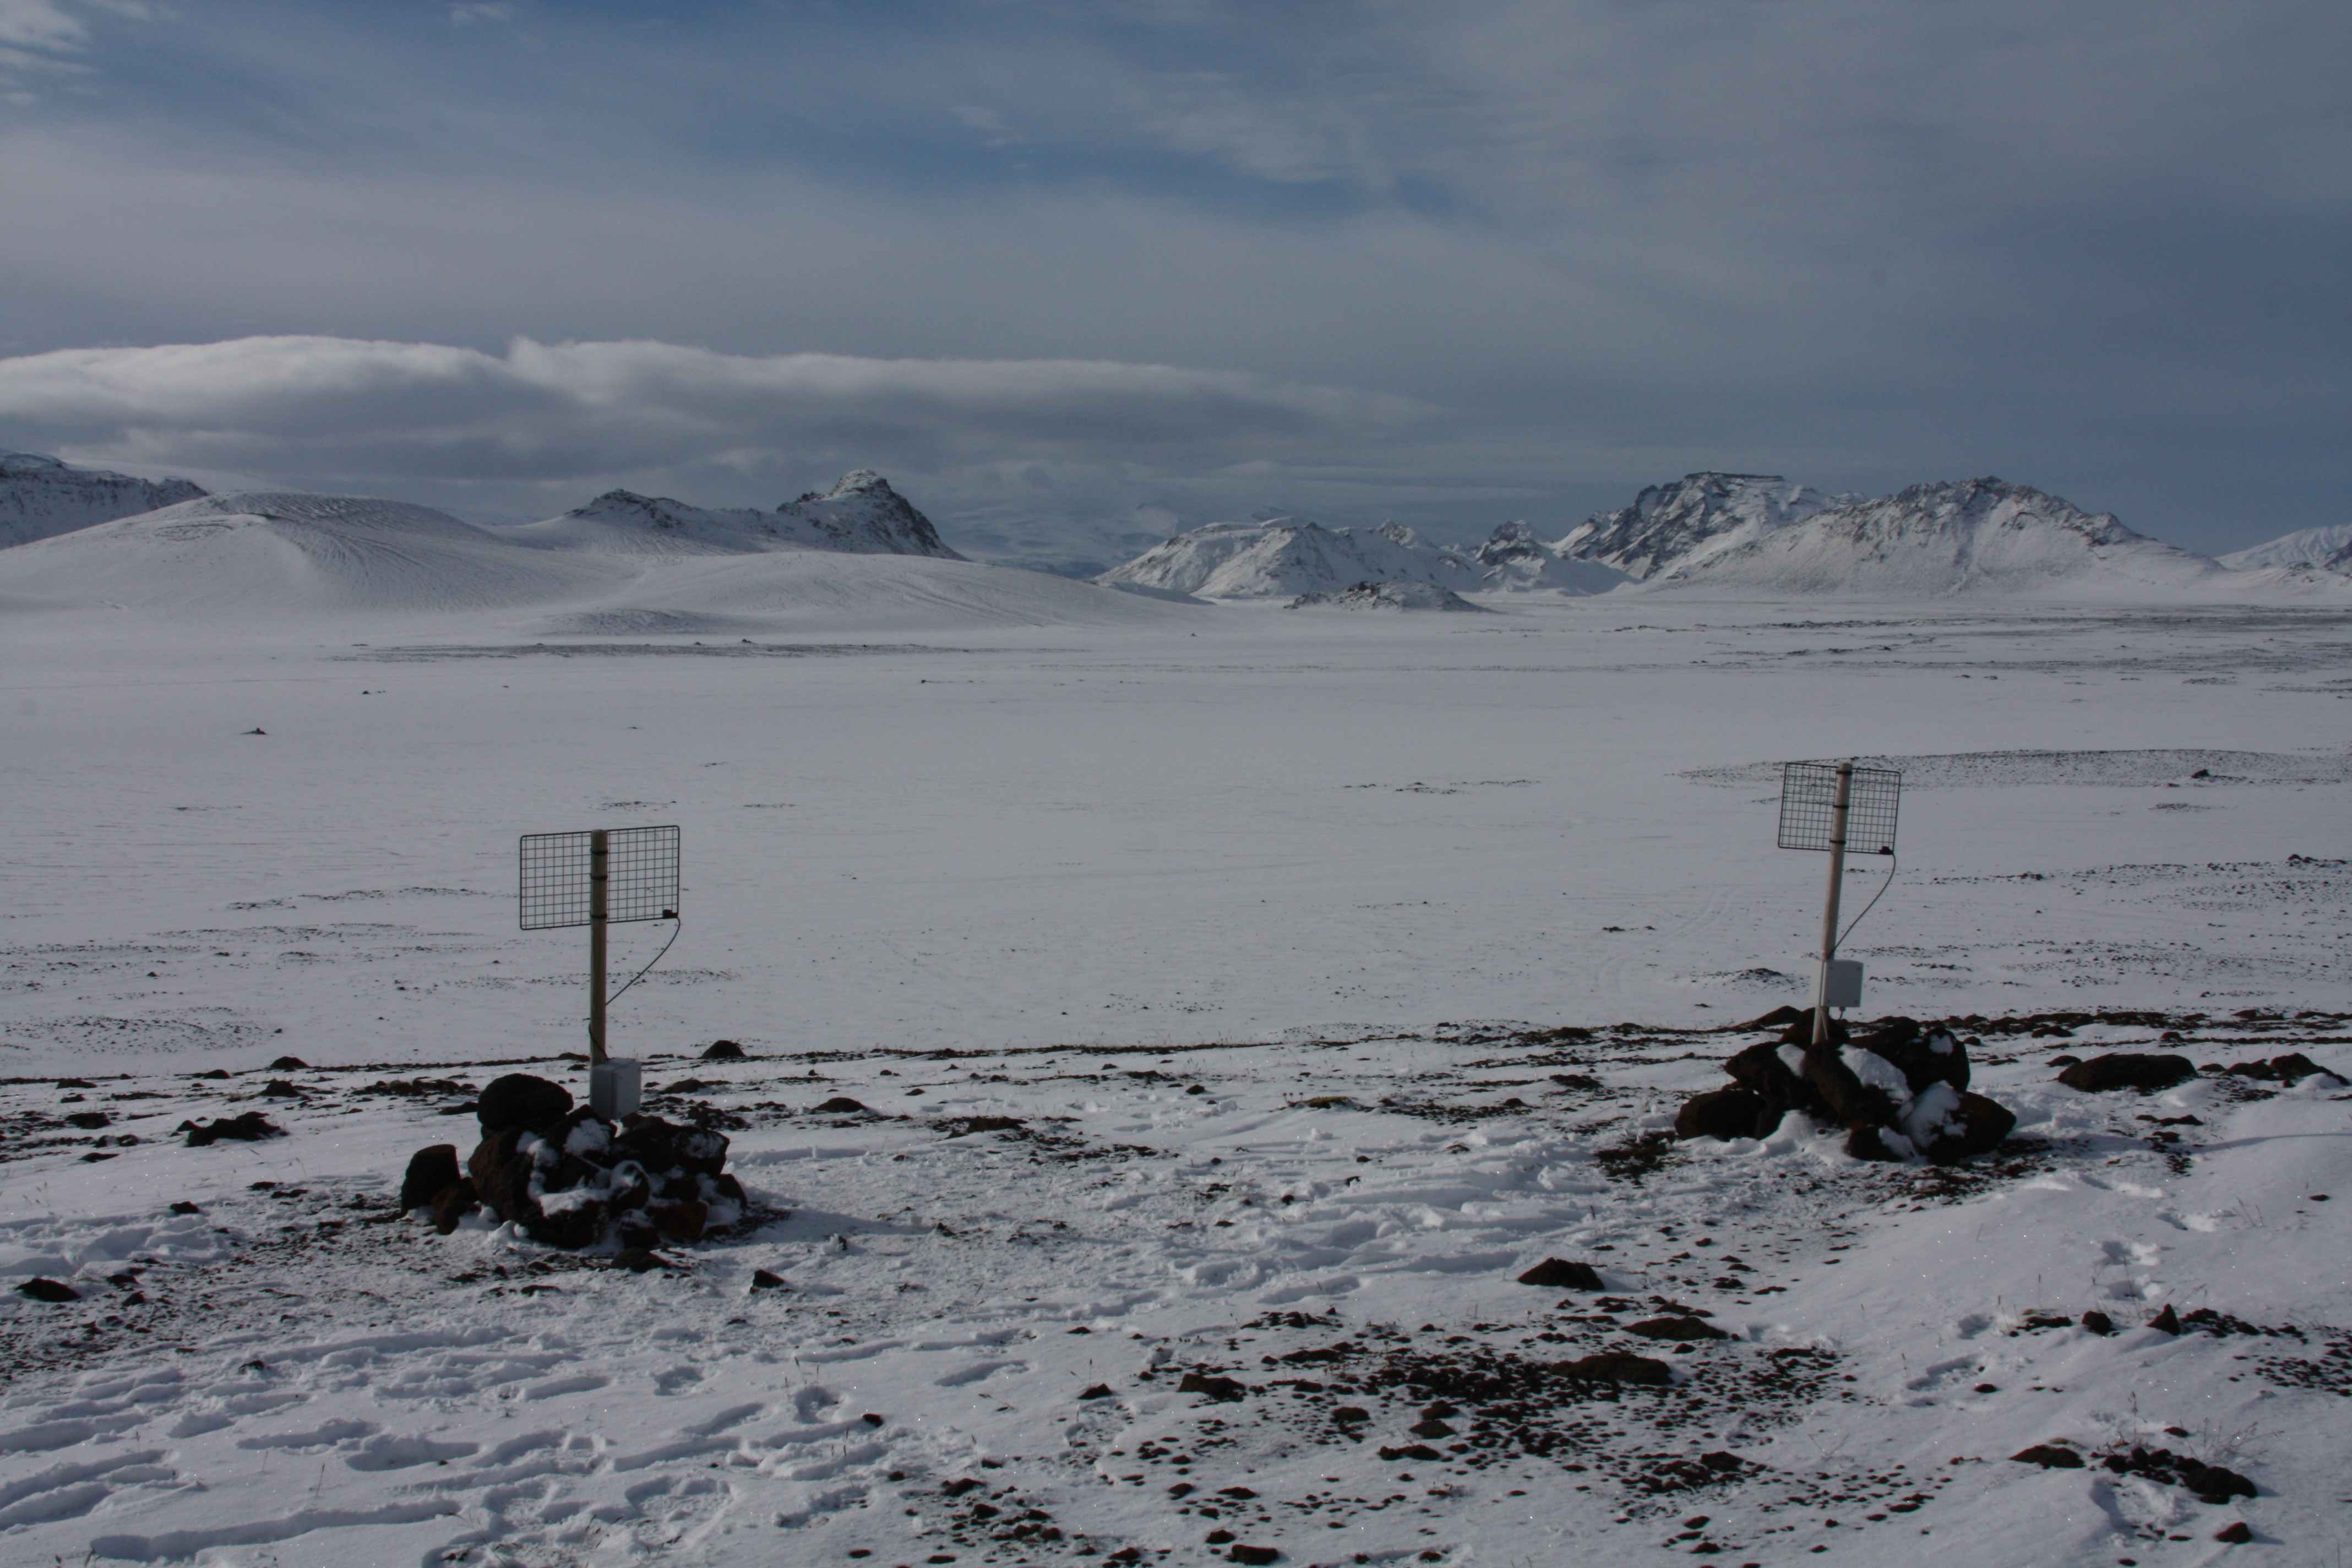
Electrostatic surveyers. These antennas are orientated towards the Katla volcano and are connected to sensors, which can detect changes in the electrostatic field. A volcanic plume causes such changes, due to the frictional electricity. Since these sensors were calibrated in field experiments, the signal curves can be used to estimate the mass flux.
For real-time mass flux assessment, however, many of these approaches have high uncertainty as they often depend on estimates or assumptions of the values of additional (and usually poorly known) source parameters. For example, to get the MER, both the infrasound technique and the pulse analysis approach require knowledge of the exact vent geometry, which has either to be guessed (usually by very simplified models) or in turn to be derrived by applying yet another measurement method. One way to get this information is to analyze the trajectories of big ejecta (these big clasts are cleverly called "bombs" in vulcanological terms) [9].
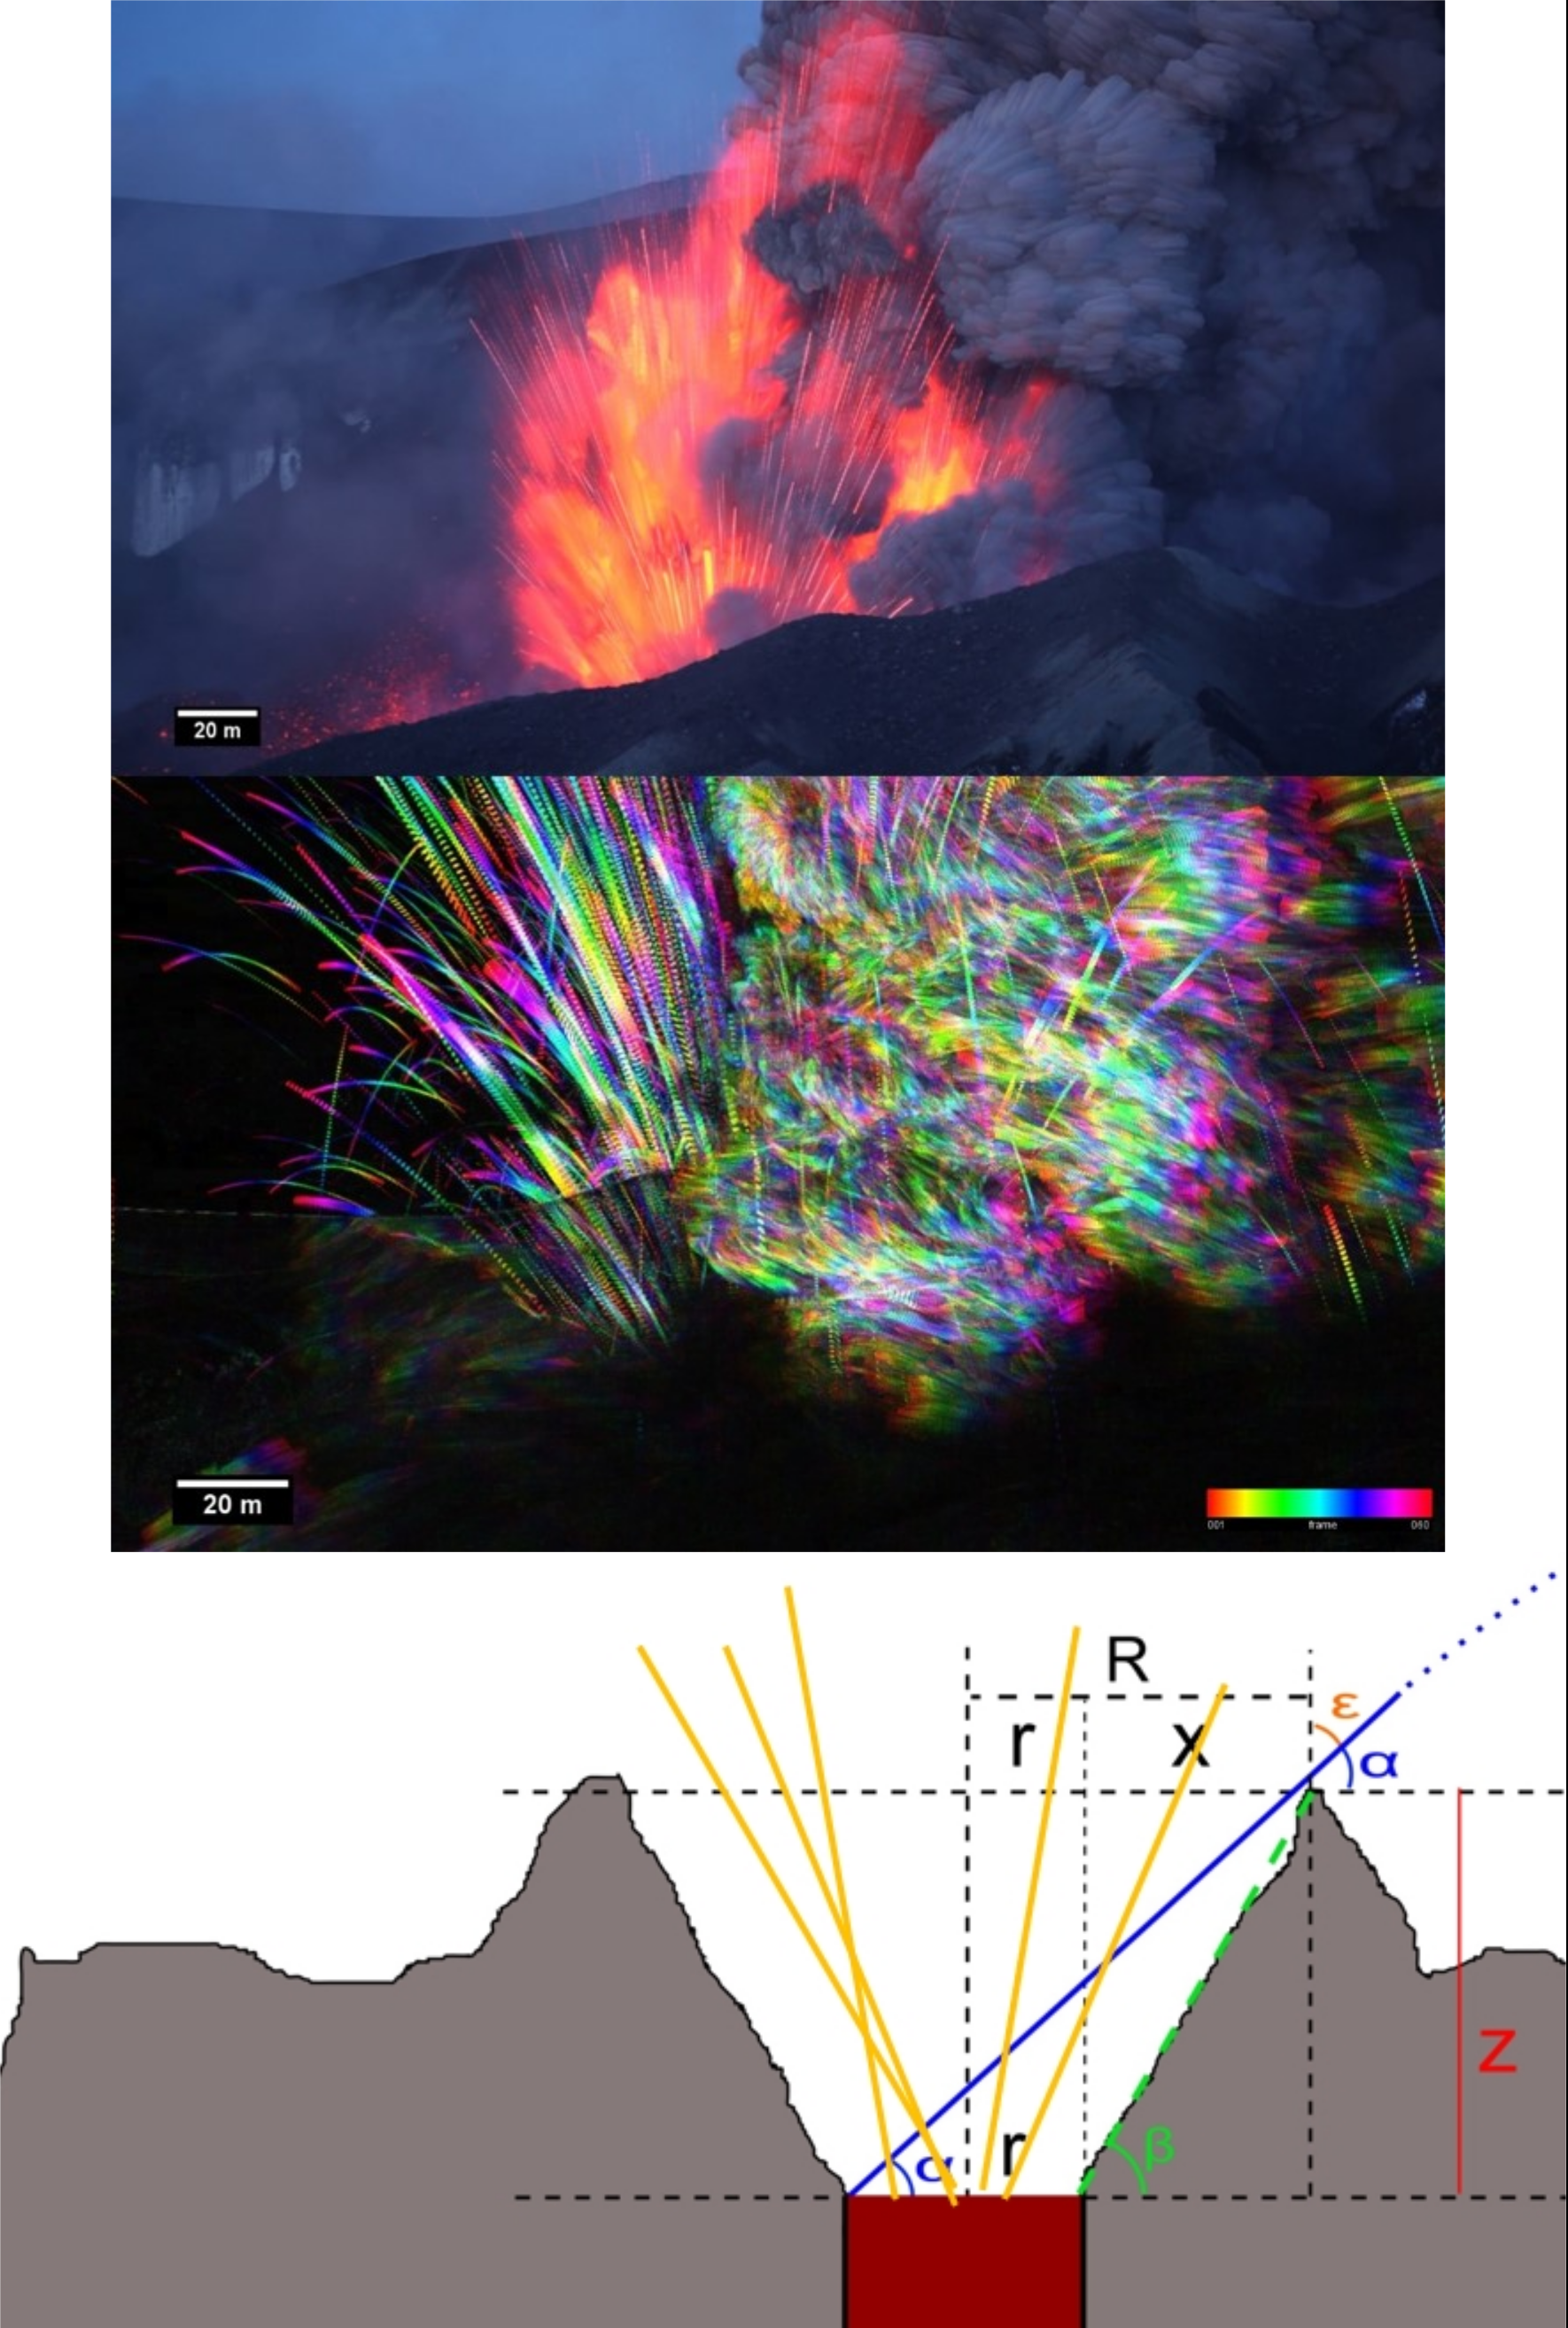
Tracing bombs. With tracking the trajectories of big clasts in combination with simple geometrical considerations it is possible to reconstruct the vent geometry [9]. The snapshot on top is from a movie taken by Martin Rietze [10].
The most prominent, straightforward and reliable observable in an explosive eruption is usually the height of the eruptive column H.
A number of "plume height models" have been developed, which link H with the mass flux at the vent. These models are either based on the theoretical plume model by Morton et al. [13] in 0D or (under consideration of a cross-flow) in 1D [14], on 3D models in a so called "pseudo-gas" approximation [15,16], or on empirical data fitting (in "0D") [17]. In the latter approach recorded plume height data is linked with erupted mass reconstructed from field findings. When plotted over each other, the curve, which best describes the relationship between these two parameters, is used as an "empirical" law.
Also time-dependent 2D [18] and 3D multiphase models [19] exist and are able to capture the details of plume dynamics but, due to their high computational demand, are currently not suitable for plume simulations in real-time given the available computational resources. The simple "zero" and one-dimensional steady models have the advantage of providing fast results, but are affected by the limitations introduced by the initial assumptions and simplifications on which they base.
Due to large uncertainties affecting present-day models, there is general consensus that the only way to obtain mass flux estimates in real-time is the application of integrated approaches. One example for this strategy is represented by the multi-parameter system “REFIR”, which was developed within the EU FP7 supersite project FutureVolc [20].
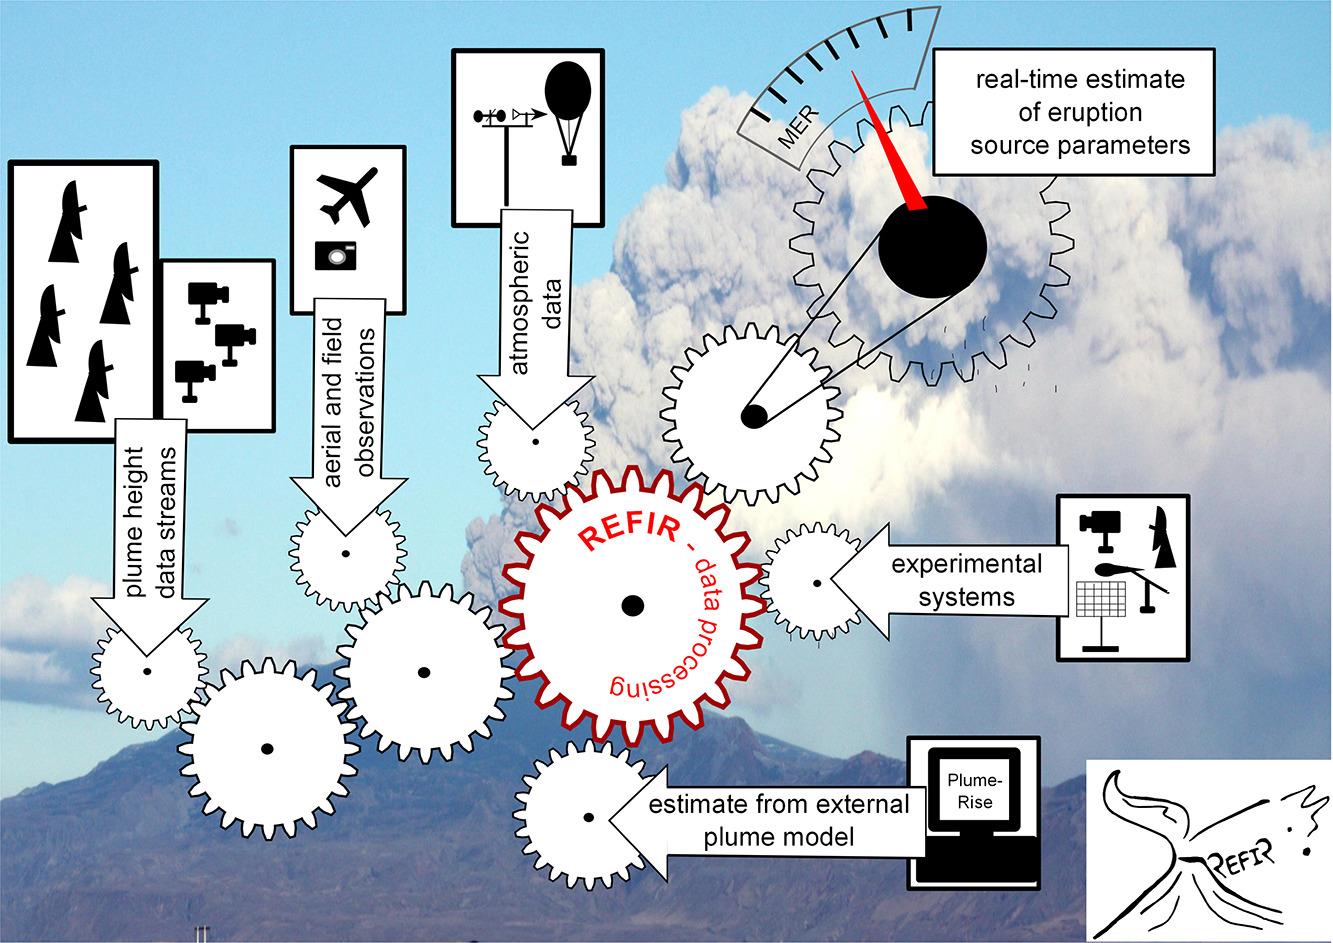
The integrated approach followed by REFIR: fed by multiple types of sensors and data stream, the mass eruption rate and plume height is estimated in near-real time (Figure adapted from Dürig et al. 2018 [20] ).
The “philosophy” behind REFIR is to use a variety of different models which can be separately weighted, assuming that the accuracies of these models are specifically dependent on the eruptive conditions: a model which might provide accurate predictions under certain circumstances might still be inferior to other models when facing other eruptive scenarios.
MAXI-Plume is all about finding out which of the REFIR models works best under certain conditions, and exploring how to enhance them to improve the quality of mass flux estimates by this system.
Therefore, MAXI-Plume tackles three of the major reasons for the limited accuracy of real-time 1D plume height models:
- Uncertainties in existing methods for height assessment
- Lack of agreement on the description of entrainment
(in particular for wind-affected plumes) - Unsteady source conditions
These three important aspects are not the only sources of uncertainties for 1D models. Further difficulties arise, for example, from the complexities of ash generation processes (i.e., magma fragmentation) which determine the flow conditions at the source, from the effects of water vapour in the plume, or from the multifaceted aggregation processes during ash transport. Like 0D models, 1D models inevitably oversimplify the complex 3D reality. They are capable of reanalyzing only certain features of it.
Tackling three of the major error sources and using ground truth data to investigate which of the tested models provides the most accurate prediction under specific eruptive conditions are the key goals of MAXI-Plume and will lead to an improvement of the mass flux assessment ability of REFIR.
Disclaimer:
The lines of thought above are based on considerations detailed in Dürig et al. (2018) [20], if not cited otherwise. Please let me know if you have any comment or suggestions for changes. My email address is: tobi[_at]hi.is
References and annotations:
[1]: Taddeucci, J. et al: High-speed imaging of Strombolian eruptions: Gas-pyroclast dynamics in initial volcanic jets. Geophys. Res. Lett. 42 (2015).
[2]:Johnson, J. B. & Ripepe, M.: Volcano infrasound: A review. J. Volcanol. Geotherm. Res. 206, 61–69 (2011).
[3]: Ripepe, M. et al.: Ash-plume dynamics and eruption source parameters by infrasound and thermal imagery: The 2010 Eyjafjallajökull eruption. Earth Planet. Sci. Lett. 366, 112–121 (2013).
[4]: Valade, S., Harris, A. J. L. & Cerminara, M. Plume Ascent Tracker:Interactive Matlab software for analysis of ascending plumes in image data. Comput. Geosci. 66, 132–144 (2014).
[5]: Cerminara, M., Esposti Ongaro, T., Valade, S. & Harris, A. J. Volcanic plume vent conditions retrieved from infrared images: A forward and inverse modeling approach. J. Volcanol. Geotherm. Res. 300, 129–147 (2015).
[6]: Büttner, R., Zimanowski, B. & Röder, H. Short-time electrical effects during volcanic eruption: Experiments and field measurements. J. Geophys. Res. 105, 2819 (2000).
[7]: Calvari, S. et al.: The 7 September 2008 Vulcanian explosion at Stromboli volcano: Multiparametric characterization of the event and quantification of the ejecta. J. Geophys. Res. 117, B5 (2012).
[10]: http://www.mrietze.com/
[11]: Bonadonna, C. & Houghton, B. F. Total grain-size distribution and volume of tephra-fall deposits. Bull Volcanol 67, 441–456 (2005).
[12]: Sulpizio, R. Three empirical methods for the calculation of distal volume of tephra-fall deposits. J. Volcanol. Geotherm. Res.145, 315–336 (2005).
[13]: Morton, B. R., Taylor, G. & Turner, J. S. Turbulent Gravitational Convection from Maintained and Instantaneous Sources. Proceedings of the Royal Society A: Mathematical, Physical and Engineering Sciences 234, 1–23 (1956).
[14]: for example, see: Woods, A. W. The fluid dynamics and thermodynamics of eruption columns. Bull Volcanol 50, 169–193 (1988).
[15]: Suzuki, Y. J. & Koyaguchi, T. 3-D numerical simulations of eruption column collapse: Effects of vent size on pressure-balanced jet/plumes. J. Volcanol. Geotherm. Res. 221-222, 1–13 (2012).
[16]: de' Michieli Vitturi, M., Neri, A. & Barsotti, S. PLUME-MoM 1.0: A new integral model of volcanic plumes based on the method of moments. Geosci. Model Dev. 8, 2447–2463 (2015).
[17]: for example, see: Mastin, L.G. et al.: A multidiciplinary effort to assign realistic source parameters to models of volcanic ash-cloud transport and dispersion during eruptions. J. Volcanol. Geotherm. Res. 186, 10–21 (2009).
[18]: for example: Neri, A., Papale, P. & Macedonio, G. The role of magma composition and water content in explosive eruptions: 2. Pyroclastic dispersion dynamics. J. Volcanol. Geotherm. Res.87, 95–115 (1998).
[19]: for example, see: Cerminara, M., Esposti Ongaro, T. & Berselli, L. C. ASHEE-1.0: a compressible, equilibrium–Eulerian model for volcanic ash plumes. Geosci. Model Dev. 9, 697–730