Uncertainties for plume height assessment
All models in REFIR require plume heights (fed by a regularly updated data stream) as primary input parameter. Ways to obtain plume heights are:
- visual plume height measurements, e.g., by means of a video-streams from webcams or infra-red cameras: this method requires clear visibility conditions and no (or at least low) cloud cover. (Unfortunately, Iceland is not the most favourable place to meet these weather conditions.)
- satellite-based measurements [1]: also these types of measurement are not completely independent from the cloud cover (which might prevent the view from above, depending on which frequency/band you are looking at); it requires the presence of a satellite in reasonable time periods, and suffers from a limited spatial resolution.
- ground-based radar measurements: During a future eruption in Iceland, plume height data is expected to be mainly provided by two different types of radar stations, distinguished by the frequency of their electromagnatic beams: C-band and X-band radar.
The bulk information on height values of recent eruption plumes in Iceland are based on C-band radar data. The according radar station is located in Keflavík airport, and is primarily used as a weather radar. More recently, a second C-band radar station was installed in Egilstaðir (in the East of the island). C-band radar stations have quite massive antennas, and are therefore stationary. They conduct horizontal scans at discrete angles [2]. In addition, in the last years the Icelandic Met Office (IMO) has obtained also two X-band radar stations. These sensors are small enough to be put on a trailer, and can be quickly moved into a suitable site. Considering the fact that Iceland features more than a dozen potential candidates for a future ash cloud, getting these sensors will in all likelihood turn out to be a very wise decision!
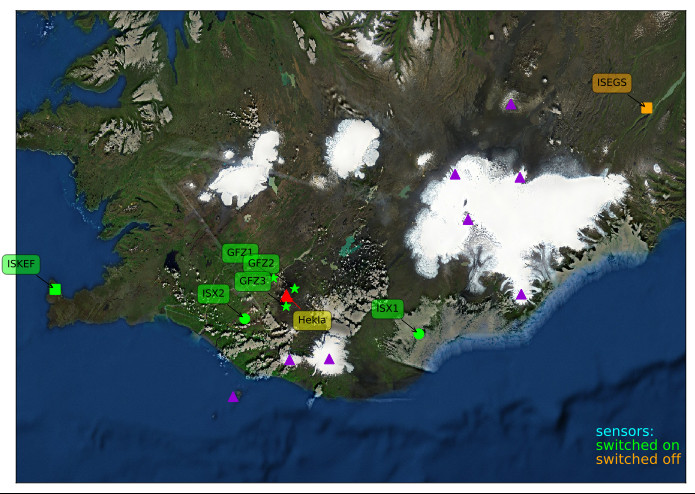
This map is a screenshot produced by the monitoring system REFIR. It shows the location of radar sensors and some volcanoes (indicated by purple triangles) in Iceland during an exercise in 2017, where an eruption at Hekla was simulated. Squares illustrate the location of C-band radar stations, circles of X-band radar stations. The location of plume tracking cameras is marked by stars. Note that for this exercise the data streamof Egilstaðir (ISEGS) has been switched off, since this station would have been too far away to provide useful data.
Although, compared to X-band radar, C-band radar has in general the advantage of having a large range of detection, the scanning technique in few discrete horizontal steps means that with increasing distance the accuracy decreases. The big advantage of X-band radar sensors, however, (next to their mobility) is that they are using vertical scan patterns, which allows the sensor to detect plume heights with a high vertical resolution.
MAXI-Plumes investigates a couple of (relatively) recent eruption plumes in Iceland as case studies: Hekla 1991 & 2000, Eyjafjallajökull 2010 and Grímsvötn 2004 & 2011.
As described above the reconstruction of plume height data for these eruptions have to be mainly based on C-band radar data with limited accuracy. As additional complication, the radar data sets are often affected by gaps. In order to fill the gaps, explore the range of uncertainties and increase the reliability of plume height records, radar data are compared with measurements from aerial and ground-based photographs. It has to be taken into account that height data obtained from photographs are also affected by errors, e.g. due to a restricted perspective or unfavorable viewing angle of a wind-distorted plume. These uncertainties can be reduced by analyzing photos taken simultaneously from different positions and applying correcting techniques.
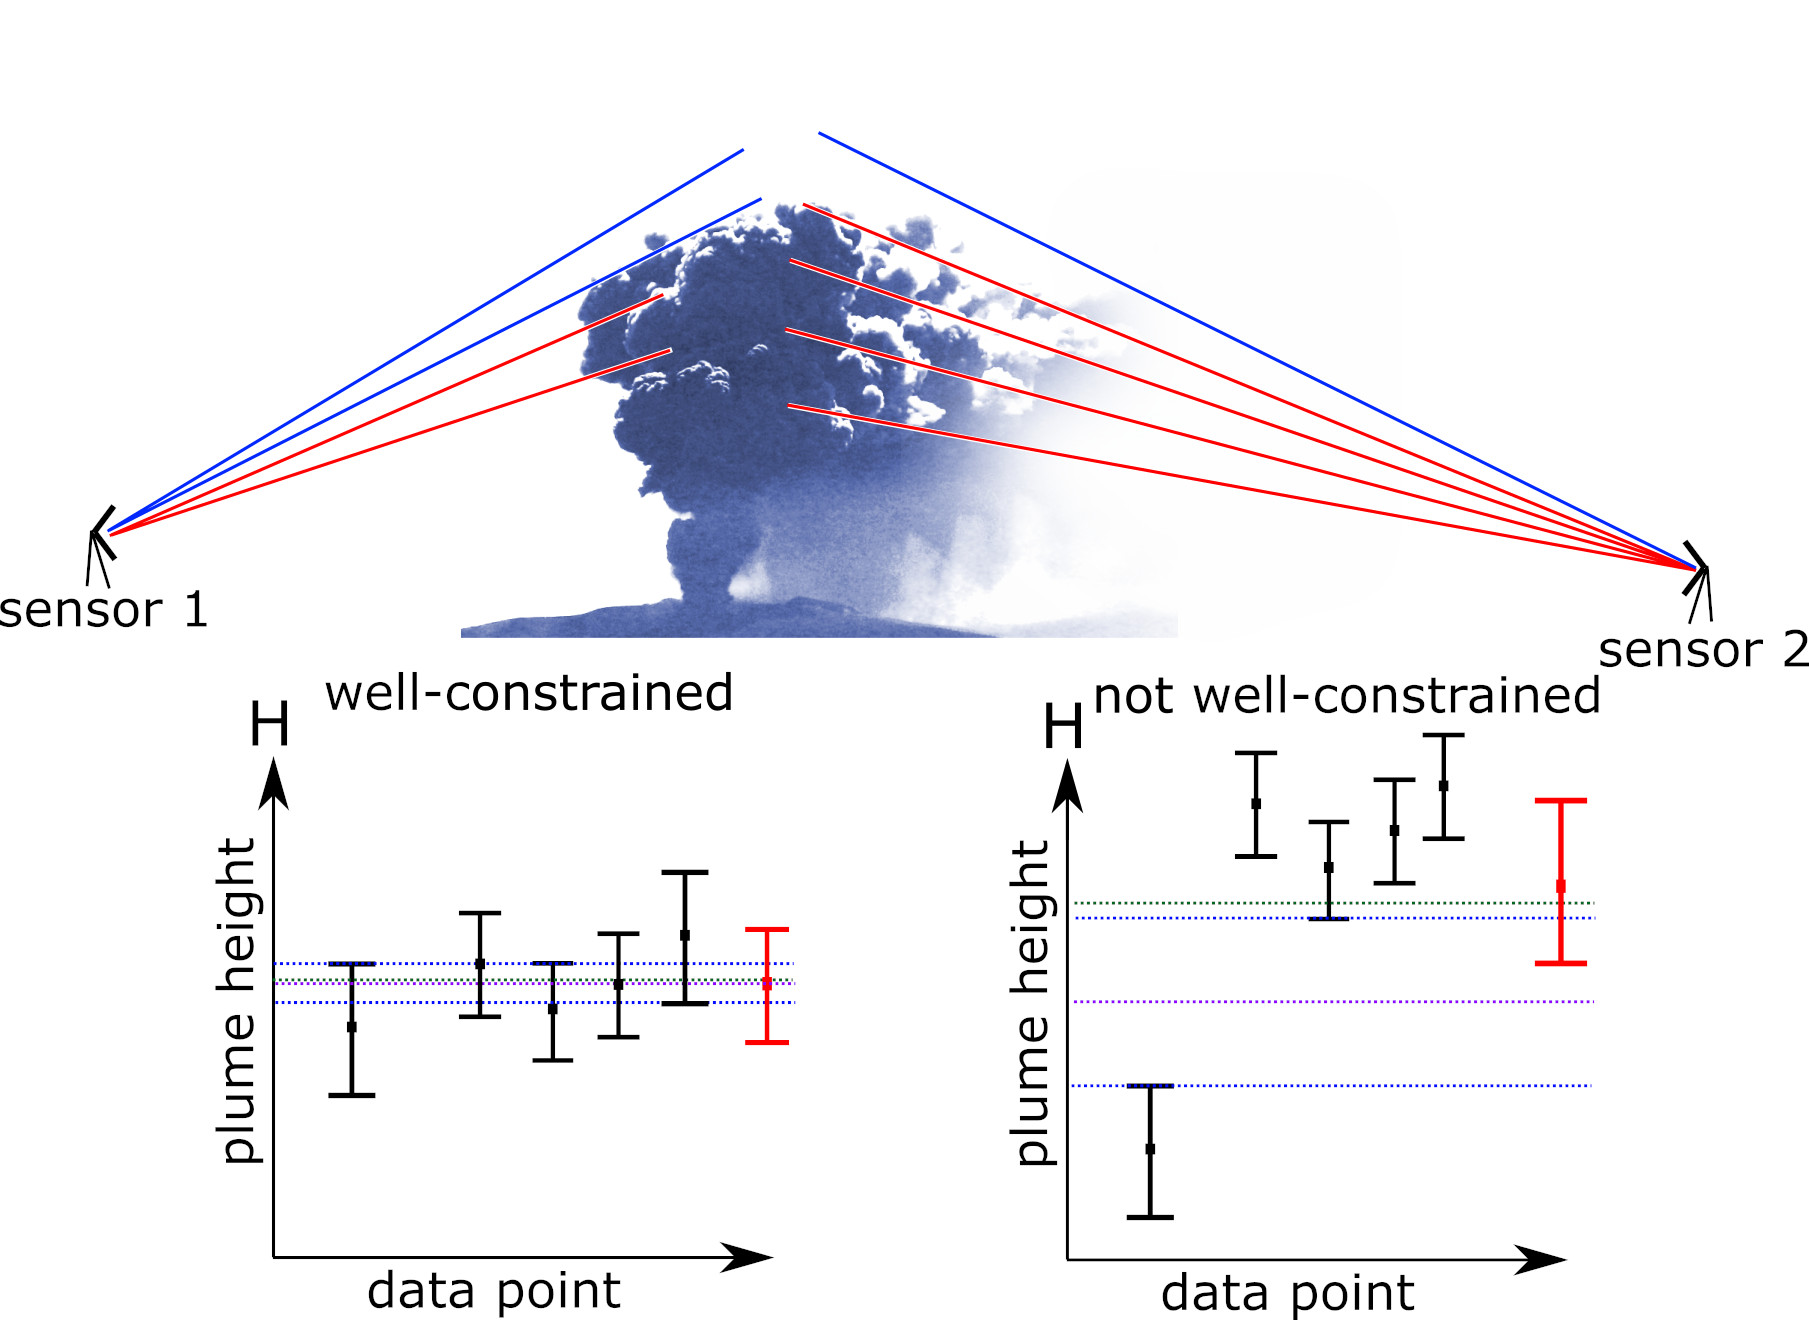
Which data to trust? REFIR is fed by a number of data streams, which might provide conflicting information. Therefore, a strategy has to be found which allows the system to constrain plume height data best. [Figure adapted from Dürig et al. [3]).
-> next challenge: lack of agreement on the description of entrainment
References and annotations:
[1]: for example, see: Marzano, F. S. Remote sensing of volcanic ash cloud during explosive eruptions using ground-based weather radar data processing. IEEE Signal Process. Mag., 28, 124–126 (2011).
[2]: Arason, P., Petersen, G. N. & Bjornsson, H. Observations of the altitude of the volcanic plume during the eruption of Eyjafjallajökull, April–May 2010. Earth Syst. Sci. Data 3, 9–17 (2011).