Image Analysis
Please note: this page refers to the setup of the Otolith Research Laboratory at the Bedford Institute of Oceanography in Dartmouth, NS, Canada. It will be updated to reflect the setup at the University of Iceland when that information becomes available.
Virtually all of the otolith examinations carried out in our laboratory take advantage of computer-assisted microscopic imaging techniques, or image analysis. Image analysis systems allow for image enhancement, manipulation, storage and quantification with an accuracy and speed that cannot be matched with the eyes or a microscope alone. In its simplest form, an image analysis system (IAS) can store an image (whether from a microscope, scanner, camera or computer) and allow for its subsequent recall and display upon command. Such a system is capable of reproducing the original image, unaltered. In practice however, images entered into an IAS are generally enhanced and/or measured before redisplay; therein lies their advantage over visual examination.
Image analysis systems are now routine in many scientific disciplines, and their applications to otolith examinations are many-fold. Some of the most frequent applications to our work are as follows:
- Image enhancement through histogram expansion, filters (convolutions) and edge detection algorithms. All of these work to enhance contrast and detail in the image, including that which is invisible to the eye. In practice, we find Photoshop to be the best product for enhancing images.
- Image quantification: this broad category includes semi-automated and automated counts and measurements of structures visible in the image. Calibrated measurements of growth increments and otolith size are our most common form of measurement. We currently use Image Pro for virtually all of these measurements.
- Shape analysis: this procedure is almost fully automated, and includes measurements of otolith length and area as well as conversion of the outline to Fourier components. We have used both Optimas and custom software to convert otolith outlines to Fourier components and are now using Image Pro.
- Image storage: subsamples of otolith cross sections are routinely imaged, enhanced and stored to add to existing reference collections for quality control. In addition, images of intact otoliths for the photographic atlas (see Otolith Shape) are enhanced and stored before submission for publication.
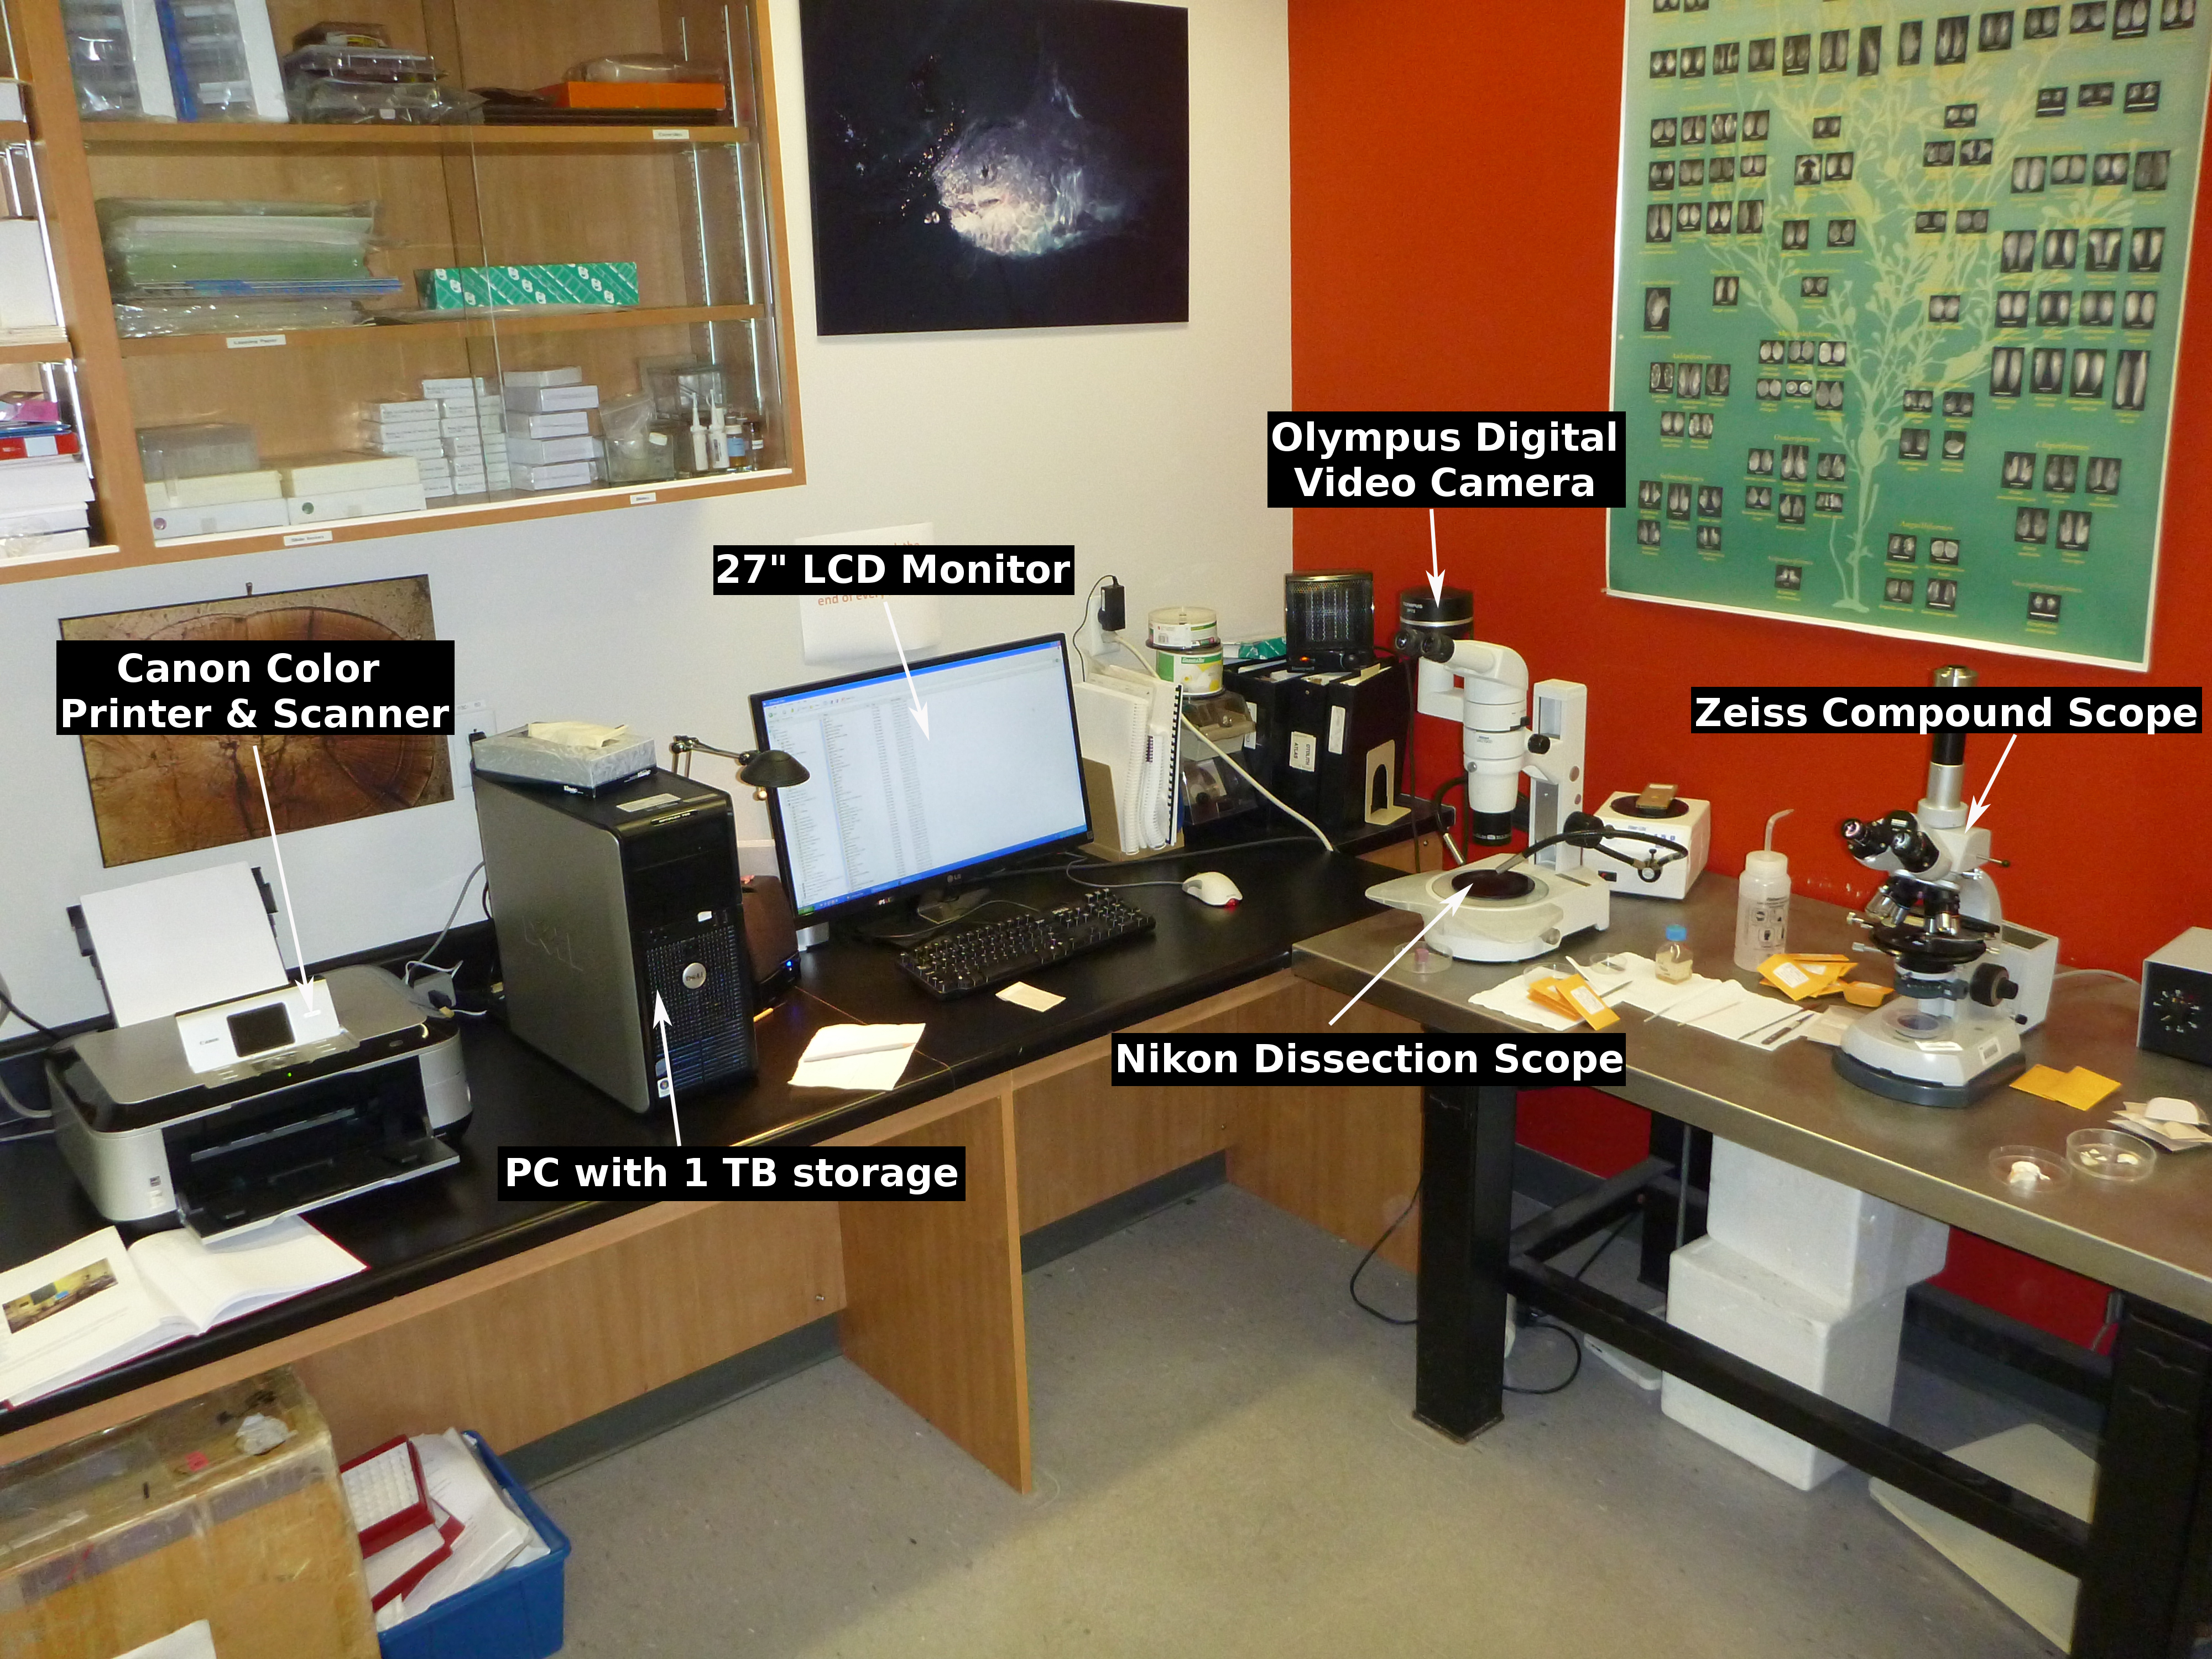
A photograph of one of our image analysis systems is depicted above. This system includes the following:
- PC with 1 TB disc storage
- 27" LCD monitor working at 1920 x 1080 resolution
- Olympus DP72 high-resolution (4140 x 3096 pixels), 12-bit colour CCD digital video camera
- Nikon SMZ1000 dissecting microscope and Zeiss Standard compound microscope on which the video camera can be mounted
- Canon MP 640 colour printer, scanner and copier printing at 9600 x 2400 dpi
- Image-Pro Premier 9.0 image analysis software
- Photoshop software
Routine image analysis procedures do not require such a high-resolution system. For example, the Ageing Unit at BIO uses image analysis systems supporting only 800 x 600 resolution for annual age determinations in support of stock assessments.
An easily-read but dated introduction to image analysis is presented in Campana et al. (1987). Examples of papers where image analysis was used include Campana (1992, 1996, 1997) and Campana and Casselman (1993).