Search: age validation

Bomb Radiocarbon and Age Validation

Steven Campana, February 3, 2016 19:37

Despite the global acceptance of otolith annuli as the best means for estimating the age of most fish species, the correct interpretation of the annuli is far from trivial, and can result in serious and systematic ageing error. Indeed, aside from the use of tagged, hatchery-reared fish released into the wild, confirming the accuracy of a method of annulus interpretation for marine fish species is often problematic. Mark-recapture of chemically-tagged individuals has generally been considered to be the most accurate means of confirming the frequency of formation of presumed annuli, through comparison of time at liberty with the number of annuli deposited distal to the chemical check. While the approach is sound, extremely low recapture rates for fish at liberty more than 2-3 years can make it difficult to acquire sufficient samples for an adequate test. Moreover, the technique validates the time elapsed since tagging, not the absolute age of the fish. Alternatively, radiochemical dating based on 210Pb : 226Ra or 228Th : 228Ra ratios can be used to differentiate between very different age interpretations, but these assays are too imprecise for detailed or individual age confirmations. The most widely used approach, that of the seasonal progression of marginal increments, is well suited only to fast-growing fish, and suffers from the lack of an objective means of evaluation. Thus there is a well defined gap in our ability to confirm the age interpretations of the majority of marine fish species, particularly those that are long-lived. However, the recent finding that nuclear testing left a dated mark in the otolith provides a significant breakthrough in our ability to determine accurate, absolute ages for individual long-lived fish.

The widespread atmospheric testing of atomic bombs in the 1950's and 1960's produced a 100% increase in atmospheric radiocarbon, which was quickly incorporated into the world's oceans. Analysis of annular growth rings in coral demonstrated that bomb radiocarbon was incorporated into the accreting coralline structure in concentrations proportional to those present in the water column. Thus the time series of bomb radiocarbon recorded in the coral was shown to reflect that present in the marine environment, which increased by about 20% between 1950 and 1970. Using accelerator mass spectrometry (AMS) as a sensitive and accurate assay tool, Kalish (1993) was able to demonstrate that the otoliths of a New Zealand fish species also incorporated 14C, and that the time series of radiocarbon reconstructed from the presumed otolith annuli was similar to that present in nearby corals. Thus he was able to infer that the otolith annuli had been interpreted and aged correctly, because systematic under- or over-ageing would have resulted in a phase shift between the otolith 14C and the coral 14C time series.

Subsequent work by both Kalish and our laboratory has confirmed the value of the bomb radiocarbon technique for solving problems of age validation in a variety of fish species. Furthermore, recent work in our laboratory has confirmed that the uptake of 14C in young fish otoliths is synchronous with that of both corals and bivalves in the North Atlantic. Such large-scale synchronicity implies that the 14C time series reconstructed from the otolith cores of old fish can be compared to one of the other North Atlantic time series; errors in annulus-based age determinations would manifest themselves as non-coherent time series.

In light of the sharp rate of increase of the 14C signal associated with the onset of nuclear testing, interpretation of the 14C chronology in otolith cores is relatively simple; the otolith chronology should match other published chronologies for the region as long as the annular age assignments (= year-class) are correct. Any under-ageing would phase shift the otolith 14C chronology towards more recent years, while over-ageing would phase shift it towards earlier years. Because marine waters with D14C values greater than 00/00 did not generally exist prior to the late 1950's, coastal fish otolith cores with sub-zero values must have formed before the late 1950's. Even contamination with material of more recent origin could only increase the 14C value, not decrease it. Thus the 14C value sets a minimum age to the sample, and the years 1958-1965 become the most sensitive years for 14C-based ageing.

While techniques such as the mark-recapture of chemically-tagged fish can be used to accurately validate the annual frequency of formation of growth increments in the otolith, especially in young or abundant fishes, only radiocarbon from nuclear testing has the potential to confirm both annulus formation and absolute age in individual fish. All studies to date suggest that bomb radiocarbon can be used to confirm the accuracy of an ageing method to within 1-3 yr, or even less than 1 year in special circumstances (Melvin and Campana 2010).

Radiocarbon chronology in marine waters show a similar year of increase (around 1956) whether from corals, bivalves or otoliths

Radiocarbon chronology in marine waters show a similar year of increase (around 1956) whether from corals, bivalves or otoliths

The only constraints to this procedure are the relatively high cost (~$700-$1000 per otolith) and the requirement for fish hatched during the 1958-65 period, so as to take advantage of the unique 14C values during that period. While the availability of suitable otolith samples may limit the applicability of this approach to specific stocks and species, use of bomb-derived radiocarbon as a dated otolith marker appears to provide one of the most accurate and logistically feasible methods for the age validation of long-lived species that is currently available.

For further information and the results of recent studies, see Campana (1997), Campana and Jones (1998), Campana et al. 2008, Neilson and Campana (2008), Bruch et al. (2009), Davis-Foust et al. (2009), Francis et al. (2010), Armsworthy and Campana (2010) and Melvin and Campana (2010). A review of the field is presented in Campana (1999). The Methods page provides details of otolith preparation protocols.

Age Validation Methods

Steven Campana, February 3, 2016 19:33

Information from this page should be cited as: Campana, S.E. 2001. Accuracy, precision and quality control in age determination, including a review of the use and abuse of age validation methods. J. Fish Biol. 59:197-242.

Age determination is invariably accompanied by various sources of error. A variety of methods exist through which age interpretations can be validated. The methods described below are the best available for insuring ageing accuracy, whether in support of large-scale production ageing or a small-scale research project.

Click here to see some features, advantages and disadvantages of methods used to confirm the accuracy of age interpretations. Methods are listed in descending order of scientific value. Growth structure refers to either annulus (A) or daily growth increment (D), depending on application. Methods for age corroboration (such as length frequency analysis and tag-recapture analysis) are not shown here, but are described in detail in Campana (2001).


Release of Known Age and Marked Fish into the Wild

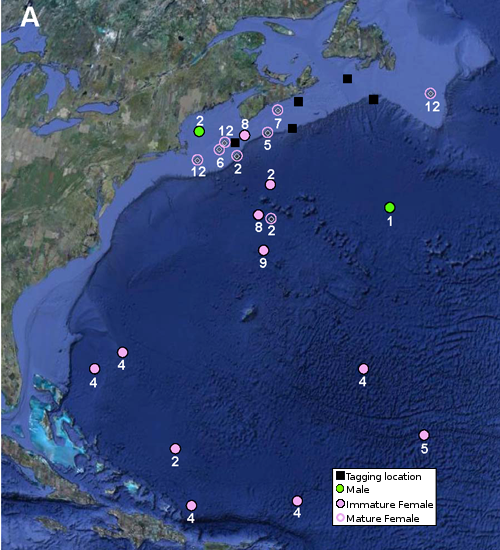
Release of known age and marked fish into the wild is probably the most rigorous of the age validation methods for many species, since the absolute age of the recaptured fish is known without error. Since the released fish are generally less than 1 yr old, recaptured fish will have spent the majority of their lives in natural surroundings. Fish can be marked either externally, as in the case of salmon with coded wire tags (Quinn et al., 1991), or immersion mass-marked using temperature fluctuations (Volk et al., 1999) or chemicals (Campana, 1999) so as to leave a permanent mark on the bony structures used for ageing. This approach is not well suited to long-lived species, since recapture rates of old fish tend to be minimal. Nor can this method be used on species which cannot be reared in captivity prior to release. Nevertheless, this method has been used with success to confirm absolute age and growth increment formation at both the daily (Tsukamoto & Kajihara, 1987; Secor et al., 1995b) and the yearly scale (Fitzgerald et al., 1997; Svedang et al., 1998).

There are two variations on this method which make it more widely available at the expense of relatively minor assumptions. The first variation involves scale removal at the time of tagging and release of wild fish. Where tagging has been restricted to relatively young fish, and where scale annuli have been found to be reliable indicators of age at that young age, the removed scale can be used to estimate the age at tagging, and subsequently be added to the time at liberty to estimate the absolute age of the fish. Where the age at tagging is short compared to the time at liberty, the advantage of this approach is that the wild tagged fish effectively become known age at release and thus need not be reared in captivity (e.g. Matlock et al., 1993). A second variation on this theme involves the tagging of young fish where age can reasonably be approximated by size. This approach was used by Lee et al. (1995) in their study of bluefin tuna (Thunnus thynnus L.), whereby tuna estimated to be 1-3 years old at the time of tagging were subsequently recaptured up to 15 years later. Although there was a ±1 year margin of error around the age estimate at the time of tagging, that margin was too small to change the conclusion that vertebral growth marks were formed annually after tagging.


Bomb Radiocarbon

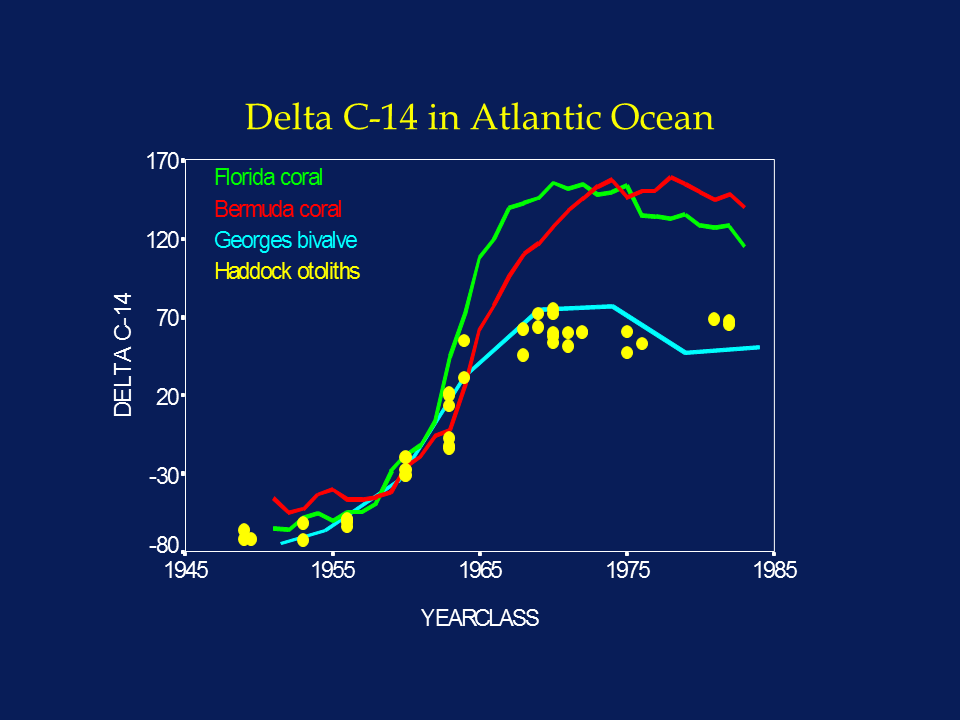
Bomb radiocarbon derived from nuclear testing provides one of the best age validation approaches available for long-lived fishes (Kalish, 1993, 1995a,b; Kalish et al., 1996, 1997; Campana, 1997, 1999; Campana & Jones, 1998; Campana et al. 2008; Neilson and Campana 2008). The onset of nuclear testing in the late 1950s resulted in an abrupt increase in atmospheric 14C, which was soon incorporated into corals, bivalves, fish and other organisms that were growing at the time. Thus the period is analogous to a large-scale chemical tagging experiment, wherein all otolith cores of fish hatched before 1958 contain relatively little 14C and all those hatched after 1968 contain elevated levels. Fish born in the transition period contain intermediate levels. As a result, the interpretation of the 14C chronology in a sample of otolith cores is relatively simple; the otolith-based 14C chronology spanning the 1960s should match other published 14C chronologies for the region (whether from otoliths or other calcified organisms) as long as the annular age assignments (= year-class) are correct. Any under-ageing would phase shift the otolith 14C chronology towards more recent years, while over-ageing would phase shift it towards earlier years. Otolith contamination with material of more recent origin can only increase the D 14C value, not decrease it. Thus the otolith D 14C value sets a minimum age to the sample, and the years 1958-1965 become the most sensitive years for D 14C-based ageing. For fish born during this time period, bomb radiocarbon can be used to confirm the accuracy of more traditional ageing approaches with an accuracy of at least ± 1-3 yr; the discriminatory power of samples born before or after this period is more than an order of magnitude lower. Since the 14C signal recorded in deepsea and freshwater environments is different from that of surface marine waters (deepsea=delayed; fresh water=advanced), reference 14C chronologies appropriate to the environment experienced during the period of otolith core formation must be used (Kalish, 1995b; Campana & Jones, 1998). Clearly, this approach is not well suited to studies of short-lived (< 5 yr) species, in instances where the presumed hatch dates do not span the 1960s, or in environments where appropriate reference chronologies are not available. On the other hand, the low radioactive decay rate of 14C implies that both archived and recent collections are appropriate for assay.

A more complete description of bomb radiocarbon-based age validation is available on the Bomb Radiocarbon section of this site. Francis et al. (2010) published a statistical method for testing the precision of bomb radiocarbon-based age validations.


Mark-Recapture of Chemically-Tagged Wild Fish

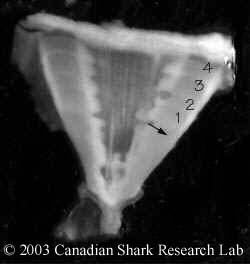
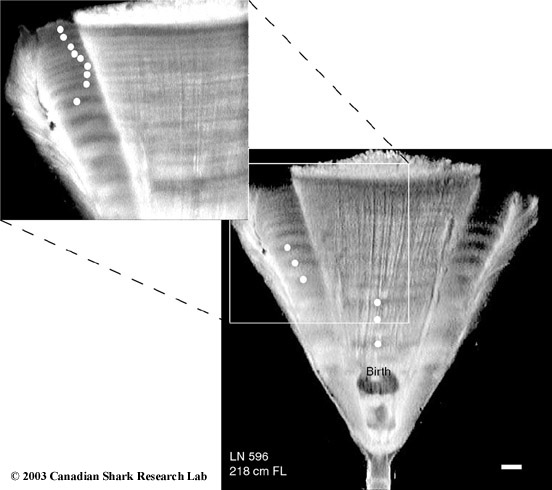
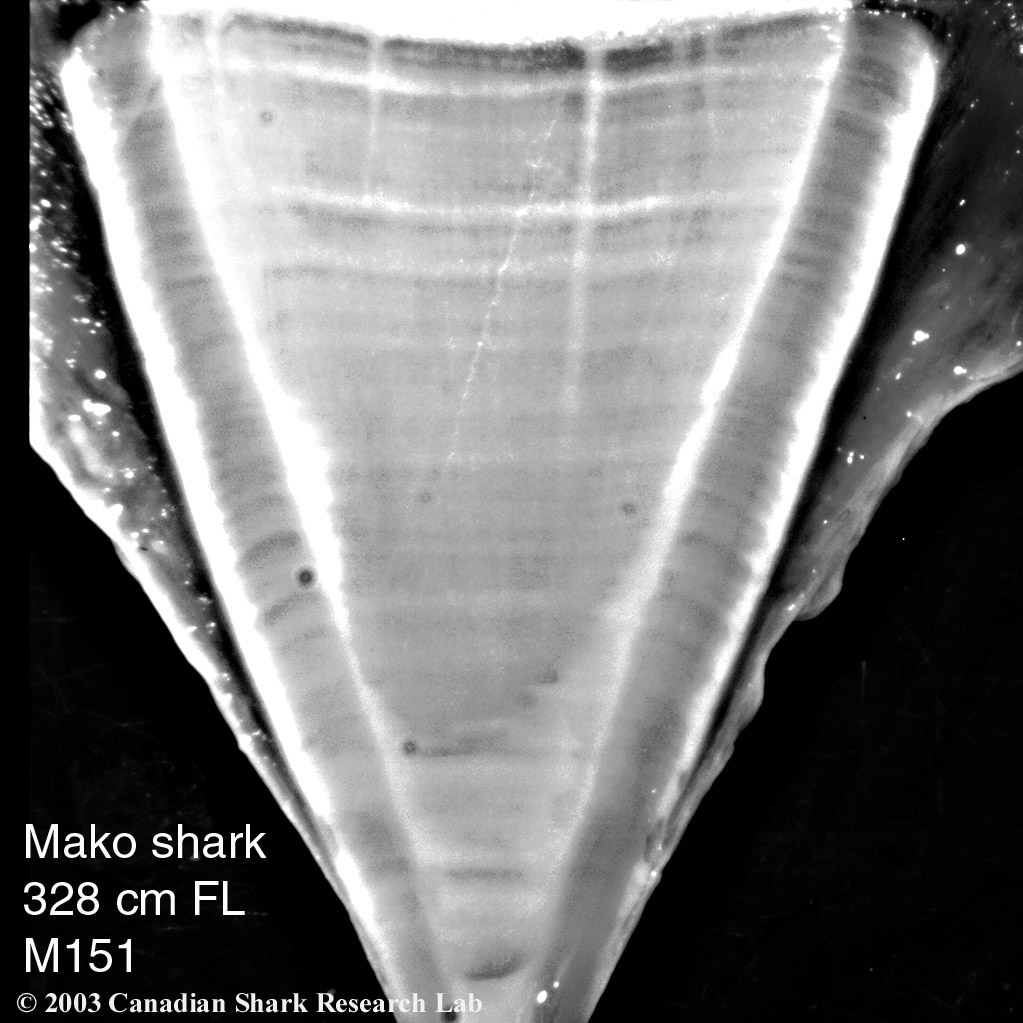
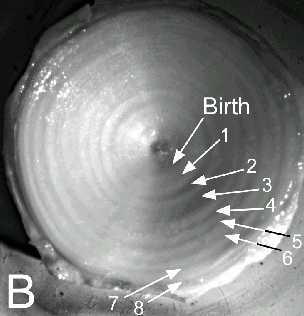
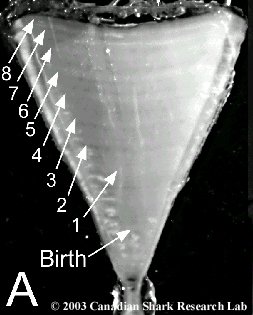
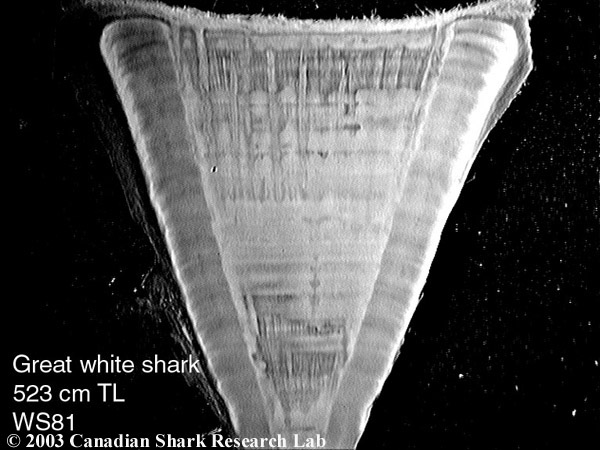
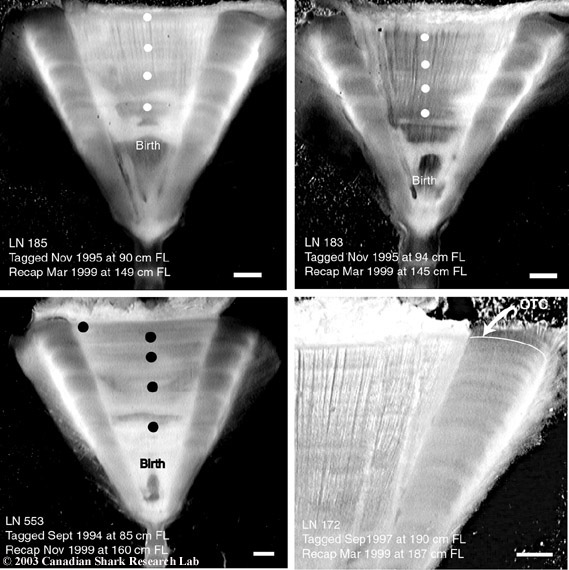
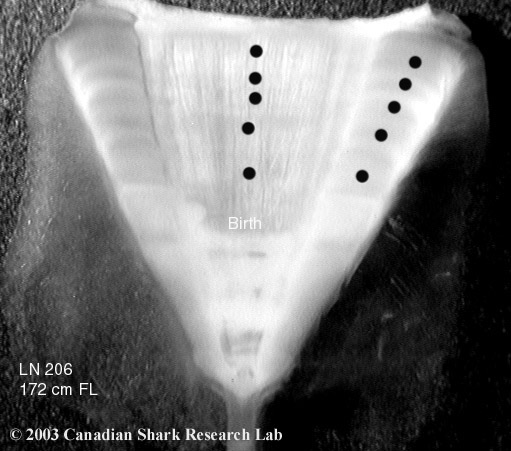
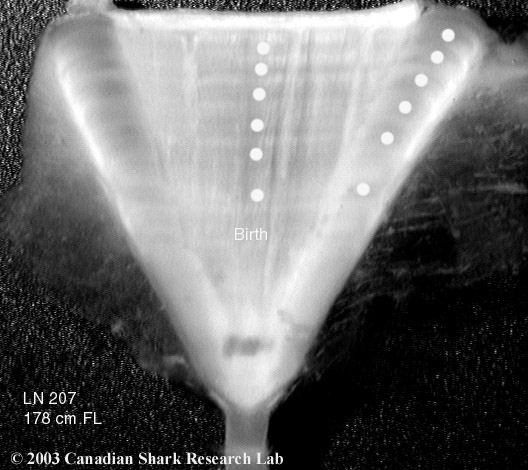
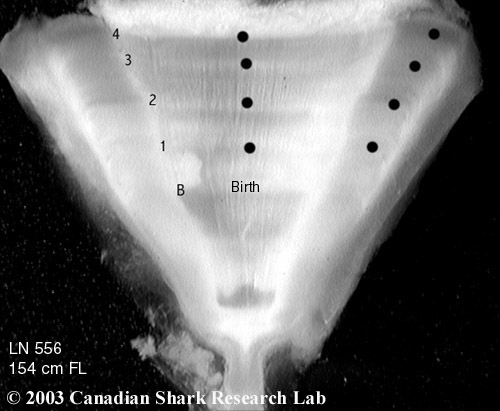
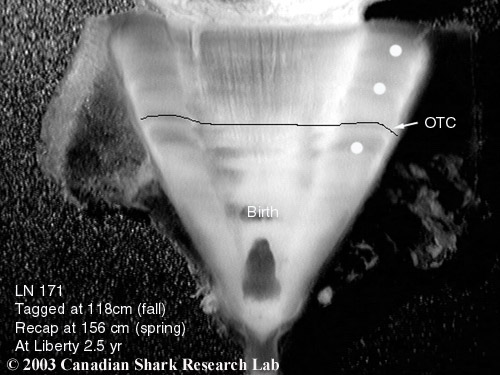
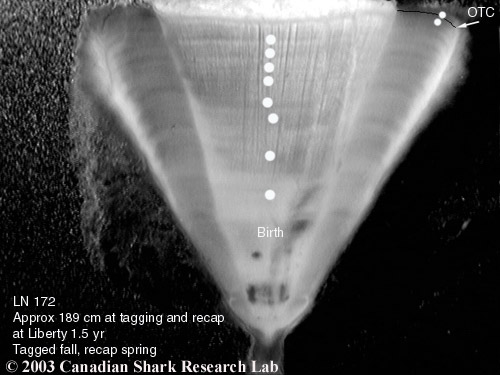
Mark-recapture of chemically-tagged wild fish is one of the best methods available for validating the periodicity of growth increment formation. The method is based on rapid incorporation of calcium-binding chemicals such as oxytetracyline, alizarin, calcein or strontium, applied at the time of tagging, into bones, scales, spines and otoliths (Campana, 1999). Application is through immersion, injection or feeding, although injection is the most practical method for tagging studies of wild fish (Geffen, 1982; Foreman, 1987; Francis et al., 1992; Oliveira, 1996). The result is a permanent mark, visible under fluorescent light (except strontium), in the growth increment being formed at the time of tagging. The number of growth increments formed distal to the chemical mark is then compared to the time at liberty after tagging. This approach has been used to validate annulus formation in a wide variety of structures and species, including sablefish otoliths (Beamish & Chilton, 1982), shark vertebrae (Brown & Gruber, 1988), pike cleithra (Casselman, 1974), spiny dogfish spines (Beamish & McFarlane, 1985), and coral reef fish otoliths (Fowler, 1990). The approach has also been used successfully at the microstructural level, validating daily increment formation in a variety of tuna species (Wild & Foreman, 1980; Laurs et al., 1985). A major advantage of this approach is that the growth increments being validated are formed while the fish is growing in a natural environment. Experiments in which fish are chemically-tagged and then reared in the laboratory or an outside enclosure (Campana & Neilson, 1982; Schmitt, 1984) are less optimal, although they are logistically easier to carry out. A disadvantage of the chemical tagging approach is that the number of increments formed after tagging is often low, resulting in a potentially large relative error if one of the increments (such as that at the growing edge) is misinterpreted. For example, misinterpretation of a single growth zone in a fish at liberty 2 years would result in a 50% error, whereas the same misinterpretation in a fish at liberty 10 years would only produce a 10% error. This effect was highlighted in a recent study in which long-term mark-recaptures detected problems with annulus identification that were not evident from short-term recaptures in the same study (Beamish & McFarlane, 2000). For this reason, fish tagged at a young age and recaptured at an old age provide the most robust validation results (Natanson et al., 2001). Notwithstanding the caveat that this method only validates growth increment formation for the size/age of fish tagged, this is a powerful method, and one of the few readily applied to adult wild fishes.


Radiochemical Dating

Radiochemical dating of otoliths is based on the radioactive decay of naturally occurring radioisotopes which are incorporated into the otolith during its growth. Once incorporated into the otolith, the radioisotopes decay into radioactive daughter products, which are themselves retained within the acellular crystalline structure. Since the half-lives of the parent and daughter isotopes are known (and fixed), the ratio between them is an index of elapsed time since incorporation of the parent isotope into the otolith. By restricting the assay to the extracted otolith core (as opposed to the whole otolith), objective, accurate estimates of absolute age are possible (Bennett et al., 1982; Campana et al., 1990, 1993; Fenton et al., 1990, 1991; Smith et al., 1991; Kastelle et al., 1994; Milton et al., 1995; Burton et al., 1999; Campana, 1999). The isotopic concentrations requiring measurement are exceedingly low, resulting in assay precisions which are often less than optimal, although recent methodological changes have substantially improved precision (Andrews et al., 1999). Current discriminatory power is on the order of 5 yr for 210Pb:226Ra and 1-2 yr for 228Th:228Ra, over age ranges of 0-40 and 0-8 yr, respectively. Therefore, this approach is best suited to long-lived species where the candidate age interpretations are widely divergent, such as in Sebastes or Hoplostethus (Campana et al., 1990; Fenton et al., 1991).


Progression of Discrete Length Modes Sampled for Age Structures

Progression of discrete length modes sampled for age structures has seldom been applied rigorously, but it is a reasonably robust approach for validating the interpretation of annuli in young fish. By monitoring the progression of discrete length modes across months within a year, it is relatively straight forward to determine if the modes correspond to age classes (Natanson et al. 2001). In instances where the length modes are well separated, can be tracked throughout the year, are not confounded by size-selective mortality, migration or multiple recruitment pulses within a year, and the mode corresponding to the young-of-the-year can be unequivocally identified, absolute age is confirmed. Examination of the ageing structures sampled from those same modes can then be used to test the validity of the presumed annuli as age indicators. This was the basis of the approach by Hanchet & Uozumi (1996), who found good correspondence between the number of presumed annuli and the age of the first three well-defined length modes (where the age was confirmed by modal progression). This approach is not equivalent to that which is more commonly applied, in which discrete length modes observed in a single sample are each assumed to correspond to an age class (Shirvell, 1981; Morales-Nin, 1989). While such an approach provides corroboration for an age interpretation, there is no independent evidence that the length modes represent age classes; thus strictly speaking, an approach that does not track modal progression through the year does not validate either absolute age or annulus periodicity. In principle, sampled modal progression should also be applicable to daily age validation. In practice however, size-selective mortality and/or migration is often pronounced in young fishes, thus invalidating the assumption that a distinct cohort is being tracked (Meekan & Fortier, 1996).


Capture of Wild Fish with Natural, Date-Specific Markers

Capture of wild fish with natural, date-specific markers is an approach that has many of the same advantages and disadvantages of bomb radiocarbon dating, since it relies on a large-scale event that applies a dated mark to all fish in a population. In the specific (and rare) instances in which it can be applied, this method can be used to validate growth increment formation over a substantial portion of a fish's life history. For example, both Blacker (1974) and Rauck (1974) reported the presence of otolith annuli which appeared to be characteristic of specific year-classes, such as the characteristically narrow 2nd year growth zone of one year-class of Bear Island cod. More recently, MacLellan & Saunders (1995) suggested that the El Nino-induced disruption of growth in one year-class of Pacific hake (Merluccius productus Ayres) could be used as a dated marker to validate the frequency of annulus formation in fish from this year-class as it grew older. Ogle et al. (1994) further developed the approach in what they termed 'temporal signature analysis', calibrating against distinct increment patterns common to most fish. In general however, such natural marks would seldom be expected to be unambiguously identifiable in individual fish, and in any event, would have to be monitored over a number of years to insure that the mark remained identifiable.

A related but different approach is to take advantage of physiologically-generated marks or checks on the ageing structure, such as the hatching, emergence or 1st feeding check of salmonids (Marshall & Parker, 1982). This can be a powerful validation method of either absolute age or increment periodicity, as long as the date of check formation can be determined through independent observation, and as long as the identity of the check is unambiguous. In the salmonid example above, once an observer had noted the date of emergence of a specific fish from the gravel, the emergence check had become a dated mark on the otolith of that fish that could then be used to validate both the absolute age and the frequency of formation of the daily increments formed until the date of capture. This method is probably better suited to daily increment validation than to annulus validation, since hatch checks (Campana & Neilson, 1985) and settlement marks (Wilson & McCormick, 1997) are common in some groups of fishes. Nevertheless, analogous marks do exist in many older fish, such as the otolith transition zone associated with the onset of sexual maturity (Francis & Horn, 1997). In all cases however, a key requirement is the independent observation of the date of the physiological event, since without it, the check is associated with an age, but not a date of formation.


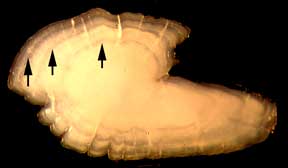
Marginal Increment Analysis

Marginal increment analysis (MIA) is the most commonly used, and the most likely to be abused, of the validation methods. The underlying premise as a method for validating increment periodicity is sound: if a growth increment is formed on a yearly (daily) cycle, the average state of completion of the outermost increment should display a yearly (daily) sinusoidal cycle when plotted against season (time of day) (e.g. Hyndes et al., 1992; Fowler & Short, 1998; Morales-Nin et al., 1998; Carlson et al., 1999). The popularity of this method can be attributed to its modest sampling requirements and low cost. However, in many ways, this is one of the most difficult validation methods to carry out properly, due to the technical difficulties associated with viewing a partial increment affected by variable light refraction through an edge which becomes increasingly thin as the margin is approached, as well as light reflection off the curved surface of the edge. The absence of an objective means of interpreting the data further complicates the situation. In their review of annulus seasonality studies, Beckman & Wilson (1995) interpreted the results of 104 MIA studies, concluding that about 30% of the species from a given region formed annuli at times different than that of the other species. It is possible that annuli did not form in all of these species, or that the time of opaque zone formation varied widely among species. Indeed, Beckman & Wilson (1995) highlighted the current lack of understanding of the mechanisms underlying annulus formation. However, a more likely explanation is that the MIA technique itself was of low resolving power. Even more problematic are studies which attempt to validate daily increment formation with MIA, working near the resolution limit of light, and confounded by the presence of subdaily increments. Although daily MIA based on transmission electron microscopy (Zhang & Runham, 1992) or using otoliths with unusually broad increments (Jenkins & Davis, 1990) has some merit, MIA studies of daily increments are, in general, of questionable value.

Marginal increment analysis is sometimes differentiated from edge analysis, but when used as a validation method, has similar properties. The marginal increment is usually calculated as a proportional state of completion, ranging from near zero (an increment is just beginning to form) to one (a complete increment has formed) as well as all values in between. When plotted as a function of month or season, the mean marginal increment should describe a sinusoidal cycle with a frequency of one year in true annuli (Lehodey & Grandperrin, 1996; Vilizzi & Walker, 1999). Edge analysis does not assign a state of completion to the marginal increment, but rather records its presence as either an opaque or translucent zone (van der Walt & Beckley, 1997; Labropoulou & Papaconstantinou, 2000). It is the change in relative frequency of each edge zone which is plotted across months or seasons, but as with MIA, the cycle frequency should equal one year in true annuli. In both MIA and edge analysis, a yearly cycle of formation can be difficult to distinguish from other frequencies, contributing to their poor performance as validation methods. Changes in the seasonal timing of the marginal increment with age or location undoubtedly contribute to the problem; significant and unexplained differences among years have also been noted (Pearson, 1996; Cappo et al., 2000). Despite the problems inherent in their use for age validation, both MIA and edge analysis are well suited for determining the month or season of formation of the opaque or translucent zone once annulus formation has been validated through independent means (Pearson, 1996; Natanson et al. 2001).

There are several reasons why MIA may provide misleading results. Prominent among these is the fact that the marginal increment is most easily discerned in young, fast-growing fish, a life history stage where the marginal increment may accurately confirm the formation of annual increments. The problem arises when the 'validation results' are later applied to older fish, contrary to the assumptions of all age validation methods. Many studies have reported age validation based on MIA of young fish, but noted that the same ageing structure and/or approach provided incorrect ages in older fish (Campana, 1984; Hyndes et al., 1992; Lowerre-Barbieri et al., 1994). More troublesome are the instances where age validation based on MIA of young fish later evolved to form the basis for routine ageing of the species across all age groups. For example, MIA of scales in young snapper (Pagrus auratus Bloch and Schneider) quickly evolved to become the basis for all scale ageing of the species in several countries; OTC mark-recapture results later showed that scale ages underestimated true age in older fish (Francis et al., 1992). A nearly identical situation took place in the northeast Pacific, where all routine ageing of sablefish (Anoplopoma fimbria Pallas) by several countries was based on scales validated with MIA. It wasn't until otolith OTC mark-recapture studies were completed that it was realized that scale ages were underestimating the age of older fish by up to a factor of four (McFarlane & Beamish, 1995). Note however that MIA misuse is not restricted to scale ageing. Annuli in whole otoliths of redfish (Sebastes spp) were validated using MIA, and subsequently became an accepted procedure of many organizations for ageing these long-lived fishes; subsequent validations have demonstrated that whole otoliths grossly underestimate age in older fish (Campana et al., 1990). The conclusion is clear: when proper age validation studies are lacking, researchers will often seize upon any available studies which can corroborate their age interpretations. And since MIA is one of the few validation methods which is restricted to young, fast-growing fish, it is also the most likely to lead to serious ageing error when applied blindly.

It is difficult to recommend the use of a technique where the data can be so subjectively interpreted. Nonetheless, the approach is valid if done with sufficient rigor. Four aspects of a rigorous protocol appear to be important: 1) samples must be completely randomized before examination, with no indication to the examiner when the sample was collected; 2) a minimum of two complete cycles needs to be examined, in accordance with accepted methods for detecting cycles; 3) the results must be interpreted objectively, extending well beyond the "looks like a cycle to me" interpretation that is so commonly used. It is difficult to recommend one statistical test that would apply in all circumstances, although a variety of useful options have been offered (Vilizzi & Walker, 1999; Cappo et al. 2000). At a minimum however, there should be significant differences among some or all of the seasonal groups in each of the cycles examined; and 4) the MIA should be restricted to only a few age groups at a time, ideally only one. As noted by Hyndes et al. (1992) in a study of whole otoliths, examination of a sample which includes young, annulus-producing fish and older, non-annulus producing fish, can easily result in a significant annual cycle for the sample as a whole, despite the fact that the older fish by themselves would not show such a cycle. In other words, the validation results should be considered to be age-specific.


Captive Rearing

Captive rearing is generally discounted as a reliable means of validating annulus formation, but maintains some utility at the daily level. Laboratory environments are seldom able to mimic natural environments, due to their artificial photoperiods, temperature cycles, feeding schedules and limited space for diurnal vertical migrations. Since annulus formation is strongly influenced by the environment (Schramm, 1989; Beckman & Wilson, 1995), an artificial environment is likely to produce artificial annuli. Daily growth increments are much less affected by environmental conditions, due to the endocrine-driven endogenous rhythm which controls their formation (Campana & Neilson, 1985). While laboratory environments are well known for resulting in daily increments of altered appearance, the frequency of their formation is not generally an issue unless the rate of growth is unnaturally low. For this reason, laboratory experiments to confirm daily increment formation of known-age or chemically-marked fish are common (Geffen, 1992).

Mesocosms, ocean pens and outside enclosures provide improved and more natural rearing environments for validation studies than do indoor locations. For otolith microstructure studies in particular, outdoor rearing can be expected to produce daily increments which are quasi-natural in appearance and frequency, although growth rates can be artificially high in hatchery operations (Campana & Neilson, 1982; Folkvord et al., 1997). At the annual level, outdoor rearing can also be expected to produce more natural-looking growth structures, although it has not yet been determined if annuli produced under such conditions are equivalent to those of wild fish (Schramm, 1989).

For more information on age validation methods, and for a review of methods which are used for age corroboration, please see Campana (2001).

Ageing Sharks

Steven Campana, February 8, 2016 16:45

The age of a shark is determined by counting the growth rings formed on the vertebra. The vertebral rings are laid down on a yearly basis not unlike those of trees. This method is analogous to the method used in ageing bony fish using the otolith (earstone), although not as well refined. However, sharks do not have otoliths, necessitating the use of the vertebrae. The web site of the Otolith Research Laboratory gives a more complete description of age determination practices in bony fish. The web site Skates and Rays of Atlantic Canada provides detailed information and methods on the age determination of skates and rays.

Vertebrae from the backbone of the shark are prepared for ageing by embedding and sectioning them. Several vertebrae from the cervical region are first removed from the animal and all the surrounding tissue (muscle, etc) cut away from the centra. The top of the haemal arch is removed to allow removal of the spinal cord. One or two of the calcified centra are then sectioned through the centre of the centrum with a low-speed diamond-bladed saw. The cut is made perpendicular to both the centrum face and the haemal arch. For shark species with large vertebrae (like whale and basking sharks), a specialized sectioning method is required; this method is demonstrated in a YouTube video on large vertebra sectioning. Generally, paired blades separated by a 0.6 mm spacer are used to prepare a thin section with one cut. The vertebra is now ready for image analysis and identification of growth rings. Variations of the above sequence may be better suited for some shark species. For example, the vertebrae may be frozen, dried, X-rayed or pre-treated with chemical dyes to enhance visibility of the growth rings.

The vertebra of a porbeagle shark after it has been removed from the animal and the surrounding tissue removed. Some of the annular growth rings are visible on the face of the centrum.

The vertebra of a porbeagle shark after it has been removed from the animal and the surrounding tissue removed. Some of the annular growth rings are visible on the face of the centrum.

The vertebrae is then sectioned along a vertical plane in order to view the rings.

The vertebrae is then sectioned along a vertical plane in order to view the rings.

Usually, a thin section is prepared by using paired blades separated by a 0.6 mm spacer.

Usually, a thin section is prepared by using paired blades separated by a 0.6 mm spacer.

Annual rings in the vertebra of a known-age porbeagle shark. The arrowhead points to the birth ring. The subsequent rings indicate that this shark was 4 years old.

Annual rings in the vertebra of a known-age porbeagle shark. The arrowhead points to the birth ring. The subsequent rings indicate that this shark was 4 years old.

Below are some images of vertebrae from older porbeagle, blue, mako and white sharks. Click on the images to compare the differences between these species (Note: these are high resolution images, so the images will take somewhat longer to display).

Vertebrae from older sharks

Vertebra from an older porbeagle shark

Vertebra from an older porbeagle shark


Mako Vertebra

Mako Vertebra

Blue (Whole Centrum)

Blue (Whole Centrum)

Blue (sectioned)

Blue (sectioned)

Great White Vertebra

Great White Vertebra

Growth curves show the average size of a shark at each age, as determined from vertebral ring counts. Preliminary growth curves for the blue shark, the shortfin mako and the porbeagle shark are shown below. Although growth curves provide a good overall indicator of size at age, factors such as the state of health, reproductive state and local conditions can all modify the growth rate of individuals. Examples of growth curves and shark age determination are shown in Natanson et al. (2002) and MacNeil and Campana (2003).

Graph of shark species age estimates based on fork length

Graph of shark species age estimates based on fork length

Estimates of age, growth rate and longevity in sharks all assume that the vertebral rings are an accurate indicator of age. While this is probably true in most cases, confirmation of their accuracy (known as age validation) is lacking for most shark species. We now have age validation based on bomb radiocarbon for several shark species: porbeagle (in both the NW Atlantic and the South Pacific), mako and spiny dogfish.

Quality Control in Ageing

Steven Campana, February 3, 2016 19:35

The scientific and stock assessment literature contains more incorrect age data than many people recognize. In some cases, the ageing errors are present, but do not influence the conclusions. In other cases, the errors are large, rendering the conclusions meaningless. The major source of these errors is quality control, or more correctly, lack of quality control.

Quality control (QC) is normally equated with age validation, which is often difficult and expensive to undertake. However, validation is only one of the three components of QC, and in some cases, is the smallest source of error. All ageing studies which involve more than one set of ages, whether at the daily or yearly level, should incorporate a complete QC program containing the following:

  1. age validation - demonstration that the age based on counts of periodic growth increments is, on average, equal to the true age of the fish
  2. tests for bias and long-term drift - demonstration that the age reader interprets the growth increments in the same way (on average) as other age readers and at other times
  3. measures of precision - measures of repeatability among age readers or within the same age reader on different occasions

Age bias plots showing no bias (top panel) and severe underageing after Age 4 (bottom panel)

Age bias plots showing no bias (top panel) and severe underageing after Age 4 (bottom panel)

Age validation is generally accepted to be a validation of an ageing methodology rather than the ageing accuracy of an individual age reader. Therefore, it is most often applied to demonstrate that, for example, otolith sections along an axis parallel to the sulcus produce accurate ages. Current methods for the validation of fish age are described in the section Age Validation.

Validated or not, different age readers can easily interpret a given otolith in different ways. If the difference is consistent - that is, one reader is higher or lower than the other for one or more age groups, at least on average - there is a bias. A bias may also occur within a reader over a period of time, such that a given age reader interprets an otolith differently now than was the case a few years ago. Long-term drift such as this is not unusual, and can be both dangerous and difficult to detect. Standard measures of precision such as CV, APE and percent agreement do NOT detect such a bias, particularly if it occurs only in old fish. Nor can replicate readings of a sample taken from the current year detect long-term drift. However, an age bias plot is well suited to detecting bias, and should be a standard component of any ageing program.

Measures of precision are meaningless if bias is present. However, if bias is absent, the coefficient of variation (CV) and average percent error (APE) are both useful measures. Percent agreement has been widely used in the past, but is no longer used by most laboratories. The reason? Percent agreement is very sensitive to the age range in the sample: two age readers will always have higher percent agreement on a sample of young fish than on a sample of older fish. By contrast, both CV and APE are relatively insensitive to the age range. Many laboratories now require their age readers to age a subsample of a reference collection of otoliths for each stock or species on a periodic basis (eg- annually). Age bias plots and CV's are based on this comparison to ensure that long-term quality is being maintained. Ideally, age validation will have first been carried out on the reference collection, although this is not always possible. A more detailed description of age bias plots and other statistical methods for detecting bias, as well as equations for CV and APE, are presented in Campana et al. (1995) and Campana (2001).

Annuli and Age Determination

Steven Campana, February 3, 2016 19:30

Scales, bones, fin rays and otoliths have all been used to determine the age of fish, since these and other bony parts of fish often form yearly rings (annuli) like those of a tree. However, otoliths generally provide the most accurate ages, due largely to their continued growth throughout the life of the fish and their acellular nature (which implies that they are not subject to resorption). These features give otoliths a significant advantage over scales and other structures, particularly in old fish. Therefore, otoliths have become the preferred structures for age determinations.

Methods for ageing skates and rays or sharks are analogous, but use vertebrae.

Despite the long-term global use of otolith annuli as age indicators, the factors influencing their formation is not clear cut. Each annulus is comprised of an opaque and translucent zone, which in many species correspond to fast and slow growth respectively. The opposite pattern is apparent in other species. In general though, the opaque zone seems to be formed during periods of increasing water temperatures, while the translucent zone is formed during periods of reduced growth, or in association with spawning.

The preferred method for otolith preparation and interpretation differs among species and age readers. In general however, microscopic examination of whole otoliths (immersed in a clear fluid) is acceptable for thin otoliths, while sectioning or the "crack and burn method" is required for other otoliths. Since otolith length may cease to grow in old fish, even while they continue to thicken, some form of cross section is required of old otoliths. The best papers on otolith preparation and annulus interpretation in temperate and tropical fish otoliths are presented in Chilton and Beamish (1982) and Fowler (1995) respectively. Detailed methods on preparing thin sections are also presented elsewhere in this site.

Intact gaspereau otolith showing annuli

Intact gaspereau otolith showing annuli

In keeping with ages derived from otolith microstructure, annular age determinations are an acquired skill, with a significant subjective component. For this reason, age validation is an important component of any ageing study, not only to confirm that the annular rings are visible in the otolith, but that they are being interpreted correctly.

Sectioned cod otolith showing annular growth increments (annuli)

Sectioned cod otolith showing annular growth increments (annuli)

As noted in Quality Control in Ageing consistency between age readers or with other bony structures is not a measure of accuracy. An additional source of error is the correct interpretation of the innermost (first) annulus, for which independent validation is often required.

Flounder otolith which has been 'cracked and burned' to show annuli

Flounder otolith which has been 'cracked and burned' to show annuli

The Ageing Unit at the Bedford Institute of Oceanography is responsible for ageing between 5,000-10,000 otoliths annually in support of stock assessments for cod, haddock and silver hake (see Production Ageing).

Cod and haddock otoliths are mass-processed: batches of 100 otolith pairs are carefully aligned and embedded in a black polyester resin. Transverse cross sections of the resin block are subsequently cut with a high-speed, water-cooled saw, yielding 100 otolith pair cross sections per plate. After coating with a transparent coating (Krylon Crystal Clear), the plates are dried and aged. All ageing is carried out under an image analysis system. Quality control through the ageing process is rigorous (see Quality Control in Ageing).

Spiny Dogfish

Steven Campana, February 7, 2016 19:51

Squalus acanthias


1) Age determination

Dogfish spines

Dogfish spines

The spiny dogfish is a long-lived, slow growing fish. The few previous studies based on spine growth suggested a growth rate of about 3.5 cm per year, while some tagging studies suggested a slower rate of about 1.5 cm per year. Until our research had been completed, neither a method for age determination nor growth rate have been validated in the northwest Atlantic. This work has been published (Campana et al. 2006).

Samples of dogfish vertebrae and spines were collected as part of an industry/science cooperative research program which was used to determine the lifespan and growth rate of dogfish in Atlantic Canada. The goal of this work was to incorporate reliable dogfish ages into a population model so as to guide fisheries management in setting a sustainable fishing quota.

The traditional method of determining the age of dogfish has been to count the growth bands visible on the surface of their dorsal fin spines. To confirm the accuracy of the ages resulting from growth band counts, a new method of age validation was developed based on date-specific incorporation of bomb radiocarbon into spine enamel. Our results indicated that the dorsal spines of spiny dogfish recorded and preserved a bomb radiocarbon pulse in growth bands formed during the 1960s, the period during which there was extensive atmospheric testing of nuclear weapons. These results confirmed the validity of spine enamel growth band counts as accurate annual age indicators to an age of at least 45 yr. Based on the age-validated spines, the growth rate of spiny dogfish in the northwest and northeast Atlantic is substantially faster, and the longevity is substantially less, than that of dogfish in the northeast Pacific.


2) Reproduction and growth

As part of an intensive study of spiny dogfish (Squalus acanthias) off the Atlantic coast of Canada, we studied the sexual maturation and growth of dogfish collected on research surveys and as part of the commercial fishery. Sexually mature and pregnant females were distributed throughout the waters of southwest Nova Scotia during the summer and fall, but moved offshore to deeper waters in the winter. Juveniles were most abundant off Georges Bank and near the edge of the Scotian Shelf during the winter. The fork length at 50% maturity for males was 55.5 cm at age 10, while that for females was 72.5 cm at age 16. Free embryos were observed in 62% of all pregnant females, with the number of embryos increasing with the size of the female. Free embryos first became apparent in June at a fork length of 16 cm, and would be expected to reach their birth size of 22-25 cm during the winter. Validated ages based on spine growth bands indicated a longevity of 31 yr. Males and females grew at similar rates until the size and age of male maturity, after which male growth rate slowed considerably. Atlantic dogfish appear to grow more quickly and die at a younger age than do northeast Pacific dogfish. Small amounts of offshore pupping in southern Nova Scotia waters probably represent the northern limits of an extended distribution centred in U.S. waters. Although they probably originate from the same population, dogfish living in the Gulf of St. Lawrence and off Newfoundland may be functionally isolated from dogfish found further south. Our results and published tagging studies suggest that both resident and migratory components of the northwest Atlantic population occupy Canadian waters. This work has been published (Campana et al. 2009b).

Reproductive system of a female dogfish

Female dogfish, ova and pups in uterus.

Female dogfish, ova and pups in uterus.

Female dogfish, oviducal (shell) gland, ova and uterus

Female dogfish, oviducal (shell) gland, ova and uterus

Figure 4 : Dogfish embryo

Figure 4 : Dogfish embryo


3) Population dynamics

Although spiny dogfish are fished commercially by Canadian fishers, the current catch quota is not scientifically based. Their high abundance in Canadian waters might make it seem that catches could be very large; however the long lifespan and slow growth rate of dogfish makes them very sensitive to overfishing. A second complication is that the spiny dogfish population in the northwest Atlantic extends from Florida in the U.S. to southern Newfoundland, with migration between Canadian and American waters. Our recent research produced a detailed population model and stock assessment which can be used as the basis for a sustainable dogfish fishery in both countries, and which properly takes into account the transboundary migration and mixing (2014 Science Advisory Report). An early review of the Canadian portion of the stock assessment is available as a 2007 Science Advisory Report and a 2007 Research Document.


4) Migration patterns of spiny dogfish

Tagging studies to date indicate that 10-20% of dogfish in Canada migrate across the Canada-U.S. border, but the frequency of migration, or even if the migration is a one-way trip, are unknown. If dogfish originate within the U.S., but migrate to Canada where they spend the rest of their lives, it may be more appropriate to manage them as a national resource rather than as a single transboundary resource.

We have two research projects underway to examine dogfish migration. Satellite tags (both PAT and X-tag) have been successfully attached to dogfish in the Bay of Fundy and the results used to track their movements in Canada and the U.S. over the course of a year. Those results are being analysed, and additional tagging is underway. A second project has surgically tagged spiny dogfish in the Bay of Fundy with acoustic transmitters in order to track their movements across acoustic receiver "fences" on the ocean bottom. This project is part of the Ocean Tracking Network (OTN).

The objectives of both tagging projects are to determine the proportion of the northwest Atlantic dogfish population which migrates across the Canada-U.S. border, the northernmost extent of any migration, and the frequency of such migrations.

Porbeagle Shark

Steven Campana, February 7, 2016 19:39

Lamna nasus

Our laboratory has conducted extensive research on the biology and population dynamics of porbeagle sharks. The support and funding of the Canadian porbeagle shark fishing industry also played a significant role in the success of this research program. Indeed, the support for this program by the Canadian shark fishing industry has been extensive, despite the fact that it was independent of any present or future fishing quotas.

Male porbeagle shark

Male porbeagle shark


1) Determination of Age and Growth Rate

Several hundred vertebrae have been sectioned, revealing growth bands or annuli. The recent effort has been to determine if these bands are formed yearly, and can therefore be used to determine growth rate and longevity in support of an age-structured stock assessment. Age validation has proceeded along several fronts: analysis of length frequency data, analysis of tag-recapture data, examination of vertebrae from tag recaptures tagged as young of the year, examination of vertebrae from recaptures tagged with oxytetracycline injections (OTC), and bomb radiocarbon assays. Our results clearly indicate that the vertebrae provide an accurate measure of porbeagle age, at least until age 26. The oldest shark aged so far was 26 years old, and calculations suggest that porbeagle may grow as old as 40 years. This work has been published (Campana et al. 2002; Natanson et al. 2002).

The photos below show some examples of prepared porbeagle vertebrae as seen using the image analysis system. Yearly growth bands appear as paired light and dark bands. Figure 1 shows vertebrae collected from porbeagle tag recaptures tagged as young of the year (YOY). These samples are important as they provide examples of sharks of known age. Growth bands on the vertebral sample in figure 2 indicate a shark of about 15 years of age. This number is not validated but the annuli are presumed to be correctly interpreted based on the similar appearance of annuli in validated vertebrae, such as those in figure 1.

Prepared porbeagle vertebrae as seen using the image analysis system

Vertebrae from young porbeagle sharks.

Vertebrae from young porbeagle sharks.

Vertebrae from older porbeagle sharks.

Vertebrae from older porbeagle sharks.

Below are some images of other known aged and OTC marked porbeagle vertebrae (Note: these are high resolution images, so the images will take somewhat longer to display).

Porbeagle Vertebrae of Known Age

porbeagle-4-eng

porbeagle-5-eng

porbeagle-6-eng

porbeagle-7-eng

porbeagle-8-eng


2) Comparison of current growth and maturity with that present in the unfished population

The porbeagle population in the NW Atlantic has been fished for more than 40 years, leaving the size of the current population at about 10% of the level that was present originally. Has this level of fishing affected growth rate and the size/age of sexual maturity? Research has now been completed to answer this question (Cassoff et al. 2007).

We tested for density-dependent changes in growth and maturation of northwest Atlantic porbeagle shark (Lamna nasus) after the population declined by 75-80% from fishing. Vertebrae and reproductive data collected from the virgin (1961-1966) and exploited (1993-2004) populations were analysed in order to test for differences in growth rate and age/length at maturity between the time periods. We detected significant differences between reparameterized von Bertalanffy growth models for each period, using likelihood ratio tests. Beyond an age of 7 years, mean length-at-age was greater during 1993-2004 than during 1961-1966. Between 1961-1963 and 1999-2001, length at maturity decreased in males (from 179 to 174 cm CFL) and was invariant in females (216 cm CFL), while age at maturity declined in both males (from 8 to 7 years) and females (from 19 to 14 years). An analysis of porbeagle temperature associations indicated that sharks occupied comparable temperature conditions during the mid-1960s and 1990s, ruling out the possibility of temperature-induced growth changes. The observed increase in growth rate and decrease in age at maturity following exploitation support the hypothesis of a compensatory density-dependent growth response.


3) Comparison of porbeagle growth and longevity in the northwest Atlantic with those around New Zealand

Porbeagle populations in the northwest Atlantic and around New Zealand differ substantially in their biological characteristics: New Zealand porbeagles reach a smaller maximum size, mature at a smaller size and greater age, and probably live considerably longer than porbeagles in the northwest Atlantic.

It appears that New Zealand and north-west Atlantic porbeagles may grow at similar rates up to an age of about four years, after which New Zealand porbeagles grow noticeably slower. Furthermore, northwest Atlantic porbeagles grow much larger than their Southern Hemisphere counterparts: sharks longer than 200 cm are common in the North Atlantic , whereas around New Zealand and Australia they are very rare. Median lengths at maturity for New Zealand porbeagles are 140-150 cm for males and 170-180 cm for females , compared with 166 cm and 208 cm respectively for northwest Atlantic porbeagles. The estimated ages at maturity for New Zealand porbeagles are 8-11 years for males and 15-18 years for females. By comparison, north-west Atlantic porbeagles mature slightly younger at about 8 and 13 years for males and females respectively. The longevity of New Zealand porbeagles is uncertain, but is at least 38 years and could be as old as 65 years. The oldest porbeagle aged in the northwest Atlantic was 26 years. All of these differences imply that the porbeagle population in the northwest Atlantic is more productive than that in the south Pacific. There is also strong evidence that vertebral growth bands cease recording annual growth bands in very old or slow-growing sharks (Francis et al. 2007)

A comparison of porbeagle size and maturity characteristics throughout the world is available in Francis et al. (2008).


4) Sexual maturity

Intensive sampling on board commercial fishing vessels was used to document the seasonal and length-based development of all of the reproductive tissues. In addition to measurements of the size of some internal organs (oviduct, shell gland, ovary, uterus, eggs, and embryos in females; claspers, siphon sac, testes, epididymis, ampulla and sperm packets in males) many of the above were also examined histologically. Size and age at sexual maturity were determined for each sex. Initial results indicate that 50% of male porbeagles are mature at a fork length of 174 cm (age 8), while females do not mature until a fork length of 217 cm (age 13). This work has now been published (Jensen et al. 2002).

Click on the images below to compare the internal differences of immature and mature porbeagles (Note: these are high resolution images, so the images will take somewhat longer to display).

Internal differences of immature and mature porbeagles

Immature female porbeagle.

Immature female porbeagle.

Immature male porbeagle.

Immature male porbeagle.

Mature female porbeagle.

Mature female porbeagle.

Mature male porbeagle.

Mature male porbeagle.


5) Porbeagle in relation to temperature

The fishing industry has kindly made available hundreds of detailed records of fishing location which include both sea surface temperature and temperature profiles. These have been analyzed to determine distribution patterns in relation to water temperature, depth and time of year. Our results indicated that porbeagle are most often caught at depths of 35-100 metres at water temperatures of -2 to 15 deg C. The average temperature at the depth of the fishing gear was consistently 7-8 deg C at all times of the year. Water depth was not associated with catch rate, although porbeagle tended to be in shallower water in the fall than in the spring. Since porbeagle are among the most cold-tolerant of the pelagic shark species, they appear to have evolved to seek out coldwater prey by taking advantage of their thermoregulating capability. This work has been published (Campana and Joyce 2004).


6) Satellite tagging of porbeagle

Until recently, the location of the porbeagle pupping ground has been completely unknown. In order to identify the migratory pathways and pupping grounds, a project was initiated in which sexually mature porbeagles were tagged with archival satellite popup tags while on their mating grounds in early fall. In early spring (which is when the females give birth), the popup tags released from the sharks and transmitted their data. The results were startling - all of the mature females migrated south to the Sargasso Sea (between Bermuda and Cuba) to give birth to their pups. The migration required the sharks to traverse the Gulf Stream, whose water temperatures are too warm for the cold-water porbeagle. Therefore, the porbeagles literally dove underneath the Gulf Stream to depths of 1360 metres to avoid the warm water. While in the Sargasso Sea, the porbeagles maintained an average depth of almost half a kilometre, which probably explains why they have remained undetected over the years. This research has been published (Campana et al. 2010).

This information will allow Canada and/or ICCAT to decide if international fisheries management and/or designation of protected pupping areas is required.

An archival satellite popup tag attached to a live mature porbeagle shark.

An archival satellite popup tag attached to a live mature porbeagle shark.

Map showing tagging and popup locations for 21 porbeagles tagged off the eastern coast of Canada. Male and immature female sharks stayed north of latitude 37°N, while all mature females migrated to the Sargasso Sea by April. Month of popup indicated by number.

Map showing tagging and popup locations for 21 porbeagles tagged off the eastern coast of Canada. Male and immature female sharks stayed north of latitude 37°N, while all mature females migrated to the Sargasso Sea by April. Month of popup indicated by number.


7) Population dynamics

Commercial catch rates, length frequencies, tag recaptures and estimates of the age composition of the population have been integrated and used to reconstruct a perspective on the population dynamics and sustainable harvesting level of porbeagle off the eastern coast of Canada. A first product of this investigation was a detailed stock assessment for porbeagle tabled late in 1999. An updated and improved stock assessment was tabled in the spring of 2001 (2001 Stock Status Report), and was used as the basis for a new management plan. An overview of some of the results has been published (Campana et al. 2002; Campana et al. 2008).

In 2004, by the Committee on the Status of Endangered Wildlife in Canada (COSEWIC) recommended that porbeagle sharks be designated as Endangered, based on the stock information summarized in Campana et al. (2003). If listed as an endangered species, all commercial fishing for porbeagle would be prohibited. The Canadian government decided against listing porbeagle under the Species At Risk Act (SARA), due to rigorous conservation measures in the new shark management plan.

To update and improve the available information on porbeagle, a comprehensive stock assessment was carried out in 2005, concluding that the 2005 female spawner abundance was about 12% to 15% of its 1961 level, although population numbers had remained relatively stable since the reduction of catch quotas in 2002 (Stock Assessment Report 2005). All analyses indicated that the population could recover, but that human-induced mortality needed to be kept below about 4% of vulnerable biomass (about 185 t per year) (Recovery Assessment Report 2005). The most recent stock assessment indicates that population recovery has already begun (Stock Assessment 2010) (Stock Assessment 2012).


8) Post-release mortality of porbeagle measured with satellite tags

Porbeagle sharks are highly migratory and spend substantial periods in Canadian waters before moving to international waters. ICCAT has approved new regulations supporting the live release of porbeagles caught in international waters, but the post-release survival of porbeagles has never been measured. We will soon be starting research to measure post-release survival in commercially-caught porbeagles using archival satellite popup tags. A better understanding of porbeagle post-release survival will improve the accuracy of both the Canadian and international stock assessments, and thus simplify the management and international governance of this species.


9) Diet

As part of the detailed sampling being carried out on board commercial vessels, stomach contents of 1022 porbeagles have been examined and weighed to determine the diet of these large predators.

Our results indicate that the porbeagle shark is an active and opportunistic predator feeding on a diverse group of fish and invertebrates throughout the water column. For the first half of the year the porbeagle's diet consists mainly of pelagic fish (especially mackerel, herring, longnose lancetfish) and squid. Cod, flounder, lumpfish and other groundfish are commonly seen in stomachs taken in the fall, when many porbeagle are in shallower water. Other examples of less common prey include wolffish, spiny dogfish, sandlance, redfish, small crabs and the odd shellfish or gastropod. Overall, 91% of the weight of the stomach contents was fish. As well as living organisms, porbeagles have been known to take small bits of garbage and debris floating in the water column. Pieces of fishing line and rope, shiny packaging, wrappers, and plastic have all been found in their stomach contents. This work has now been published (Joyce et al. 2002).

Click on the photos below to see some examples of common and less common prey (Note: these are high resolution images, so the images will take somewhat longer to display).

Common Prey

Longnose lancet fish.

Longnose lancet fish.

Flounder.

Flounder.

Uncommon Prey

Lumpfish.

Lumpfish.

Wolffish Head.

Wolffish Head.

Radiochemical Dating

Steven Campana, February 3, 2016 19:38

Age determination studies based on elemental or isotopic concentrations in the otolith are motivated by the ongoing requirement for accurate age-structured information in support of many fish studies. The objectivity of elemental assays is appealing in light of the subjectivity that can confound or invalidate the interpretation of annuli in otoliths or other structures. As a result, all chemically-based age determination studies to date have focused on the yearly scale, and virtually all have been used to validate more traditional, less expensive methods of age determination.

Radiochemical dating of calcified structures has a long history in corals and molluscs. The same underlying concepts apply to fish otoliths, and are based on well established physical principles governing radioactive decay. Radioisotopes are incorporated into fish otoliths in exactly the same way as are stable isotopes of any given element. Once incorporated into the otolith, the radioisotopes decay into radioactive daughter products, which are themselves retained within the acellular crystalline structure. Since the half-lives of the parent and daughter isotopes are known (and fixed), the ratio between them is an index of elapsed time since incorporation of the parent isotope into the otolith. Secular equilibrium is approached as the rate of loss (through decay) of the daughter comes to equal the rate of loss of the parent. Radioisotope ratios in whole otoliths can be interpreted if some rather problematic assumptions can be met. However, the extracted otolith core reflects elapsed time since core formation, which in turn is very similar to the age of the fish. Since interpretation of the otolith core also avoids the problematic assumptions, it is widely acknowledged to provide more reliable results than would the whole otolith.

Two isotopic pairs have proved popular in ageing problematic fish species: 210Pb : 226Ra and 228Th : 228Ra. When based on analysis of the extracted core, the radiochemical approach appears to be both objective and accurate in the estimation of fish age. Nevertheless, the isotopic concentrations requiring measurement are exceedingly low, resulting in assay precisions which are often less than optimal. Current discriminatory power is on the order of 5 yr for 210Pb : 226Ra and 1-2 yr for 228Th : 228Ra, over age ranges of 0-40 and 0-8 yr, respectively. Therefore, this approach is best suited to species where the candidate age interpretations are widely divergent, such as in Sebastes or Hoplostethus.

Examples of radiochemical dating as applied to age validation in temperate and tropical species are presented in Campana et al. (1990), Smith et al. (1991), and Campana et al. (1993).

Scientists

Steven Campana, February 3, 2016 19:16

This site contains a breakdown of the Otolith Research Laboratory's work. See the pages below to see an overview of our scientific research.

Microstructure and daily increments

Annuli and age determination

Age validation methods

Quality control in ageing

Bomb radiocarbon and age validation

Radiochemical dating

Otolith shape

Elemental composition as a natural tag

Laser-based elemental assays

Reconstruction of temperature history

Growth models and backcalculation

Recruitment and young fish

Image analysis


Technical Publications

Steven Campana, January 19, 2016 16:10

Click on a citation to view a PDF version of the file.

Campana, S. E., Fowler, M., Houlihan, D., Joyce, W., Showell, M., Miri, C. and Simpson, M. 2015.  Current status and threats to the North Atlantic Blue Shark (Prionace glauca) population in Atlantic Canada.   DFO Can. Sci. Advis. Sec. Res. Doc. 2015/026. v + 44 p.

Campana, S. E., Fowler, M., Houlihan, D., Joyce, W., Showell, M., Simpson, M., Miri, C., and Eagles, M. 2015.  Recovery potential assessment for porbeagle (Lamna nasus) in Altantic Canada.  DFO Can. Sci. Advis. Sec. Res. Doc. 2015/041. iv+45 p. 2015.

Cortés, E., Domingo, A., Miller, P., Forselledo, R., Mas, F., Arocha, F., Campana, S., and others. 2015. Expanded ecological risk assessment of pelagic sharks caught in Atlantic pelagic longline fisheries. Collect. Vol. Sci. Pap. ICCAT 71(6): 2637-2688.

Fowler, G.M. and Campana, S.E. 2015. Framework assessment and 2013 update using a stage-based population model for spiny dogfish (Squalus acanthias) in the Northwest Atlantic. DFO Can. Sci. Advis. Sec. Res. Doc. 2015/065. v + 134 p.

CAMPANA S.E. 2014. Age determination of elasmobranchs, with special reference to Mediterranean species: a technical manual. Studies and Reviews. General Fisheries Commission for the Mediterranean. No. 94. Rome, FAO 2014. 38 p.

Campana, S. E. and Fowler, M. 2012. Age determination without tears: statistical estimation of silver hake (Merluccius bilinearis) age composition on the basis of otolith weight and fish length. DFO Can. Sci. Advis. Sec. Res. Doc. 2012/079. ii+19p.

Campana, S. E., Gibson, A. J. F., Fowler, M., Dorey, A., and Joyce, W. 2012. Population dynamics of Northwest Atlantic porbeagle (Lamna nasus), with an assessment of status and projections for recovery.  DFO Can. Sci. Advis. Sec. Res. Doc. 2012/096. iv + 84 p.

Campana, S.E., J. Brading, and W. Joyce. 2011. Estimation of pelagic shark bycatch and associated mortality in Canadian Atlantic fisheries. DFO Can. Sci. Advis. Sec. Res. Doc. 2011/067: vi + 19p.

Neilson, J. D., Busawon, D. S., Andrushchenko, I. V., Campana, S. E., Carruthers, E. H., Harris, L. E., and Stokesbury, M. 2011. A review of approaches to assess survival of released catch from Canadian large pelagic longline fisheries. CSAS Res. Doc. 2011/091: iv + 33 p.

Trzcinski, M.K., Armsworthy, S.L., Wilson, S., Mohn, R.K. and Campana, S.E. 2011. A framework for the assessment of the Scotian Shelf and Southern Grand Banks Atlantic halibut stock. DFO Can. Sci. Advis. Sec. Res. Doc. 2011/002 vi + 112 p.

Campana, S. E., Gibson, A. J. F., Fowler, M., Dorey, A., and Joyce, W. 2010. Population dynamics of porbeagle in the northwest Atlantic, with an assessment of status to 2009 and projections for recovery. Collect. Vol. Sci. Pap. ICCAT, 65(6): 2109-2182.

Block, B. A., Lawson, G. L., Boustany, A. M., Stokesbury, M. J. W., Castleton, M., Spares, A., Neilson, J. D., and Campana, S. E. 2009. Preliminary results from electronic tagging of bluefin tuna (Thunnus thynnus) in the Gulf of St. Lawrence, Canada. Collect. Vol. Sci. Pap. ICCAT 64:469-479.

Comeau, P.A., M. J. Tremblay, S.E. Campana, G. Young, C. Frail and S. Rowe.  2009.  Review of the St. Mary’s Bay longhorn sculpin fishery.  CSAS Res. Doc. 2009/051.

Fowler, G. M. and Campana, S. E. 2009. Commercial by-catch rates of blue shark (Prionace glauca) from longline fisheries in the Canadian Atlantic. Collect. Vol. Sci. Pap. ICCAT 64:1650-1667.

Fowler, G. M. and Campana, S. E. 2009. Commercial by-catch rates of shortfin mako (Isurus oxyrinchus)  from longline fisheries in the Canadian Atlantic. Collect. Vol. Sci. Pap. ICCAT 64:1650-1667.

Trzcinski, M.K., S.L. Armsworthy, S. Wilson, R.K. Mohn, M. Fowler, and S.E. Campana. 2009. Atlantic halibut on the Scotian Shelf and southern Grand Banks (NAFO Divisions 3NOPs4VWX5Zc) – Industry/DFO longline survey and tagging results to 2008. CSAS Res. Doc. 2009/026.

Campana, S.E., J. Gibson, J. Brazner, L. Marks, W. Joyce, J.-F. Gosselin, R.D. Kenney, P. Shelton, M. Simpson and J. Lawson. 2008. Status of basking sharks in Atlantic Canada. CSAS Res. Doc. 2008/004. 67 p.

Campana, S.E., A.J.F. Gibson, L. Marks, W. Joyce, R. Rulifson and M. Dadswell. 2007. Stock structure, life history, fishery and abundance indices for spiny dogfish (Squalus acanthias) in Atlantic Canada.  CSAS Res. Doc. 2007/089.  136 p.

Neilson, J.D. and S.E. Campana 2007. Pilot study of bluefin tuna age validation. Col. Vol. Sci. Pap. ICCAT, 60(3): 1001-1007.

Campana, S., J. Brazner and L. Marks. 2006. Assessment of the recovery potential of shortfin mako sharks in Atlantic Canada. CSAS Res. Doc. 2006/091. 24 p.

Comeau, L.A. and S.E. Campana. 2006. Correlations between thyroidal and reproductive endocrine status in wild Atlantic cod. Can. Tech. Rep. Fish. Aquat. Sci. 2682: 14pp.

Zwanenburg, K.C.T., A. Bundy, P. Strain, W.D. Bowen, H. Breeze, S.E. Campana, C. Hannah, E. Head and D. Gordon. 2006. Implications of ecosystem dynamics for the integrated management of the Eastern Scotian Shelf. Can. Tech. Rep. Fish. Aquat. Sci. 2652:xiii + 91 p.

Gibson, A.J.F. and S.E. Campana. 2005. Status and recovery potential of porbeagle shark in the Northwest Atlantic. CSAS Res. Doc. 2005/53. 79 p.

Campana, S., L. Marks, W. Joyce,  and N. Kohler.  2005.  Catch, bycatch and indices of population status of blue shark (Prionace glauca) in the Canadian Atlantic.  Col. Vol. Sci. Pap. ICCAT, 58: 891-934.

Treble, M.A., S.E. Campana, R.J. Wastle, C.M. Jones and J. Boje.  2005.  An assessment of age determination methods, with age validation of Greenland halibut from the northwest Atlantic.  NAFO SCR Doc. 05/43, Ser. N5129.  20 pp.

Campana, S., L. Marks, and W. Joyce.  2004.  Biology, fishery and stock status of shortfin mako sharks (Isurus oxyrinchus) in Atlantic Canadian Waters.  CSAS Res. Doc. 2004/094.  33 p.

Campana, S., L. Marks, W. Joyce,  and N. Kohler.  2004.  Influence of recreational and commercial fishing on the blue shark (Prionace glauca) population in Atlantic Canadian Waters.  CSAS Res. Doc. 2004/069.  67 p.

Campana, S., W. Joyce,  and L. Marks.  2003.  Status of the porbeagle shark (Lamna nasus) population in the northwest Atlantic in the context of species at risk.  CSAS Res. Doc. 2003/007.

Marteinsdóttir, G,  P. Wright, E. Nielsen, I. Harms, A. Daníelsdóttir, M. Heath, A. Gallego, V. Thorsteinsson, C. Pampouli, J. Backouse, G. Begg, H. Valdimarsson, B. Gunnarsson, D. Brickman, S. Campana. 2003. METACOD: The role of sub-stock structure in the maintainance of cod metapopulations. Marine Research Institute, Report series nr.93.

Campana, S.E.  2002.  Sharks of Atlantic Canada.  DFO Information Brochure.

Campana, S., P. Gonzalez, W. Joyce and L. Marks.  2002.  Catch, bycatch and landings of blue shark (Prionace glauca) in the Canadian Atlantic.  CSAS Res. Doc. 2002/101.

Campana, S.E. (Editor). 2001.  Proceedings of the fall groundfish stock assessment meetings Regional Advisory Process Maritimes Region.  CSAS Proc. Series 2001/040.

Campana, S., L. Marks, W. Joyce,  and S. Harley.  2001.  Analytical assessment of the porbeagle shark (Lamna nasus) population in the northwest Atlantic, with estimates of long-term sustainable yield.  CSAS Res. Doc. 2001/067.

Campana, S.E.  2001.  Shark research program.  Bedford Institute of Oceanography 2000:28-29.

Dwyer, K., S.J. Walsh, S.E. Campana and M.F. Veitch. 2001. Preliminary analysis of age validation studies in yellowtail flounder.  NAFO SCR Doc. 01/51.

Campana, S., L. Marks, W. Joyce, P. Hurley, M. Showell and D. Kulka.  1999.  An analytical assessment of the porbeagle shark (Lamna nasus) population in the northwest Atlantic.  CSAS Res. Doc. 99/158.

Boudreau, P.R., S. Campana and others.  1999.  The possible environmental impacts of petroleum exploration activities on the Georges Bank ecosystem.  Can. Tech. Rep. Fish. Aquat. Sci. 2259: 106 p.

Campana, S.E., G. Chouinard, M. Hanson, A. Frechet and J. Brattey. 1998. Stock composition of cod aggregations near the mouth of the Gulf of St. Lawrence in January 1996 based on an analysis of otolith elemental fingerprints. CSAS Res. Doc. 98/55.

Campana, S.E. and A. Frechet.  1998.  Stock mixing of cod in 3Ps and its influence on the stock assessment.  Unpublished document. 10 pp.

Campana, S.E., G. Chouinard, P. Fanning, D. Bowen and J.D. Neilson.  1997.  Brief to the House of Commons Standing Committee on Fisheries and Oceans on the issue of provision of scientific advice to DFO.  Unpublished document.  4 pp.

Campana, S.E., T. Lambert, G. Chouinard, M. Hanson, A. Frechet and J. Brattey. 1997. The stock identity of 4Vn cod based on an analysis of otolith elemental fingerprints. CSAS Res. Doc. 97/96.

Campana, S. 1995. Expert age determination of 4VW and 4X haddock otoliths by national and international laboratories. DFO Atl. Fish. Res. Doc. 95/120.

Campana, S., P. Fanning, M. Fowler, K. Frank, R. Halliday, T. Lambert, R. Mohn, S. Wilson, W. Stobo, M. Hanson and A. Sinclair.  1995.  Report of the 4Vn Cod Working Group on the scientific value of a 4Vn cod (May-Oct) stock assessment.  DFO Atl. Fish. Res. Doc. 95/16.  110 pp.

Chouinard, G.A., A.F. Sinclair, S.E. Campana, T.C. Lambert and J.M. Hanson. 1995. Biological, environmental and fishery science considerations for the management of Atlantic cod in 4T and 4Vn. Can. Ind. Rep. Fish. Aquat. Sci. 227:vii + 45 pp.

Campana, S.E. and J.A. Gagne. 1994. Differentiation of 4T and 4Vs cod using otolith elemental fingerprints. CAFSAC Res. Doc. 94/27.

Campana, S.E.  1994. Conference Report on the International Symposium on Fish Otolith Research and Application.  Rev. Fish Biol. Fish. 4:124-125.

Campana, S. and J. Casselman. 1992. Discrimination of the 4Vs/4T cod stocks using otolith shape analysis. CAFSAC Res. Doc. 92/45.

Campana, S. and J. Hamel. 1992. Status of the 1991 4X cod fishery. CAFSAC Res. Doc. 92/46.

Campana, S.E. and E. Moksness. 1992. Report of the ICES Otolith Microstructure Workshop.  26 pp.

Campana, S. and J. Hamel. 1991. Status of the 1990 cod fishery in 4X. CAFSAC Res. Doc. 91/48.

Campana, S. and J. Hamel. 1990. Assessment of the 1989 4X cod fishery. CAFSAC Res. Doc. 90/44.

Campana, S. and J. Hamel. 1989. Status of the 4X cod stock in 1988. CAFSAC Res. Doc. 89/30.

Campana, S. and J. Simon. 1988. Stock status of 4X cod in 1987. CAFSAC Res. Doc. 88/26.

Campana, S. E. 1987. Image analysis for microscope‑based observations: an inexpensive configuration. Can. Tech. Rep. Fish. Aquat. Sci. 1569:iv+20 pp.

Campana, S. E. 1987. Age determination of tropical fishes: a laboratory manual. Bellairs Laboratory Reference Series 87/1: ii+24 pp.

Campana, S. and J. Simon. 1987. Stock assessment for the 1986 cod population in 4X. CAFSAC Res. Doc. 87/30.

Simon, J. E. and S.E. Campana. 1987. Species composition and distribution in inshore waters of southern Nova Scotia: results of exploratory trawl surveys. Can. Tech. Rep. Fish. Aquat. Sci. 1582: vii+53 pp.

Campana, S. E. and J.E. Simon. 1986. Assessment of the 4X cod fishery in 1985. CAFSAC Res. Doc. 86/35.

Campana, S. and J. Simon. 1985. An analytical assessment of the 4X cod fishery. CAFSAC Res. Doc. 85/32.

Campana, S. and J. Simon. 1984. The 4X cod fishery: a biological update. CAFSAC Res. Doc. 84/43.

Simon, J. and S. Campana. 1984. the 1983‑84, 4Vn herring biological update. CAFSAC Res. Doc. 84/66.